What Is A Breakout?
A breakout in technical analysis is when the price of a financial market moves above a resistance area or below a support area. A breakout indicates that the financial market is potentially beginning a new price trend in the direction of the breakout.
Breakouts in technical analysis most commonly occur when the price breaks out of support or resistance levels of chart patterns.
Traders will typically want to see an increase in volume when a price breakout occurs as this will add conviction to a trade being successful.
Breakouts can create buying and shorting signals for traders and investors in the financial markets where they occur and markets can trend in one direction for weeks, months or even years after a price breaks out.
Breakout traders or investors are also known as ‘trend followers’ because they seek to trade or invest in the direction of the trend of the financial instrument.
Breakouts can occur on multiple timeframes from as low as 1 minute price chart to as high as monthly or yearly timeframe price charts.
Breakouts can also occur on any price chart types including candlestick charts, line charts, point and figure charts and bar charts.
How Does A Breakout Work?
A breakout can only occur when price breaks out of a predefined support or resistance level.
Traders and investors that monitor financial markets for price breakouts will typically buy or short the market when the price breaks above or below these predefined levels in the belief that the price will continue in the direction of the breakout.
These predefined support and resistance levels are subjective and can be drawn onto price charts of financial markets by a trader, investor or technical analyst, typically in the form of chart patterns.
Chart patterns that annotate potential breakout areas include cup and handles, triangle patterns, bull and bear flags, head and shoulders, ranges and price channels.
These chart patterns make it easy to draw a support and resistance level within a capital market.
Another important component of a breakout is volume. Typically, for a price breakout to not fail, it will need to include a large increase in volume as the price breakout.
An increase in volume at the breakout level means that large traders or institutions are buying or shorting the market and that the trend may just be getting started.
Stop losses will be placed just below the previously defined resistance level or just above the previously defined support level.
Examples Of Breakouts
Below are multiple examples of price breakouts in different financial markets. These breakouts can occur in any financial market with historical price data from the stock market to cryptocurrencies.
Example Of A Breakout In The Stock Market

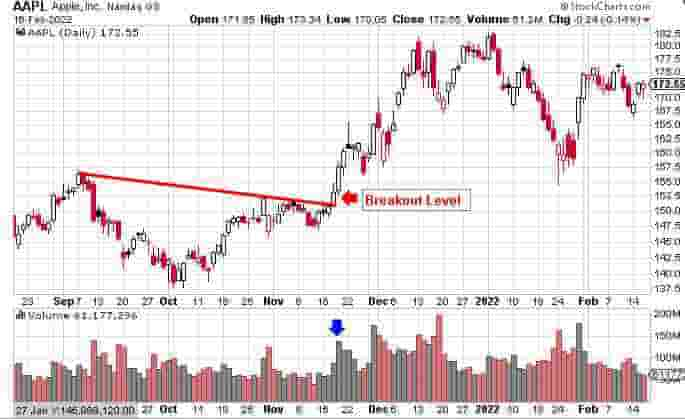
In the chart of AAPL stock above, the red line is a resistance level. As price breaks out above this resistance level, there is an increase in volume (as shown by the blue arrow).
This is a clear example of a bullish breakout in the stock and it signals the beginning of a new trend after a previous period of price consolidation.
Example Of A Breakout In The Commodity Market

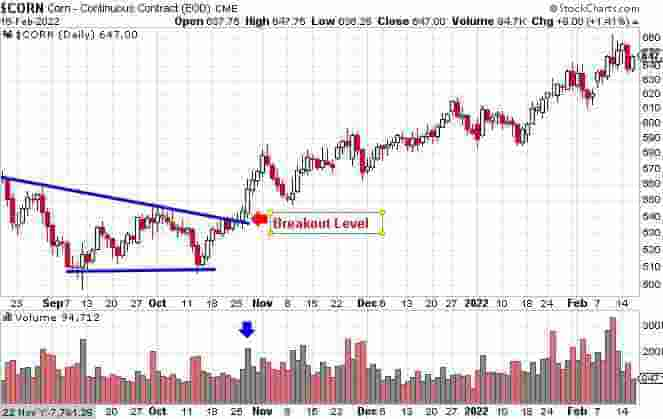
In the above price chart of Corn, the price breaks out above the resistance level (blue line) and starts a new bullish price trend.
As price breaks out, there is an increase in volume (marked with blue arrow). This is a clear example of a breakout in the commodities market.
Example Of A Breakout In The Cryptocurrency Market

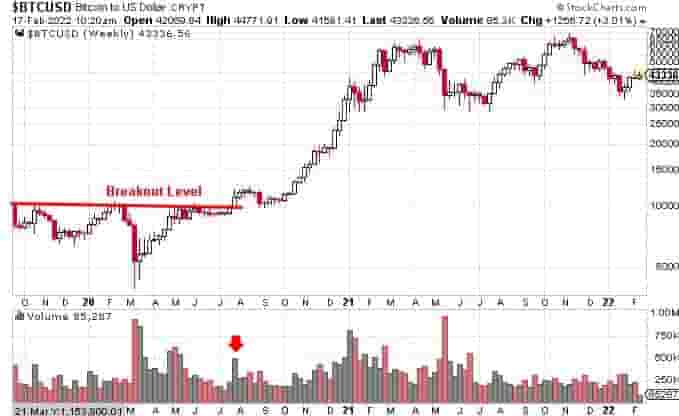
In the above price chart of Bitcoin, the price breaks out above the resistance level (marked in red) on volume (red arrow).
This signals a new multi-month bullish trend in prices. This is a clear example of a price breakout in the cryptocurrency market.
Example Of A Bearish Breakout

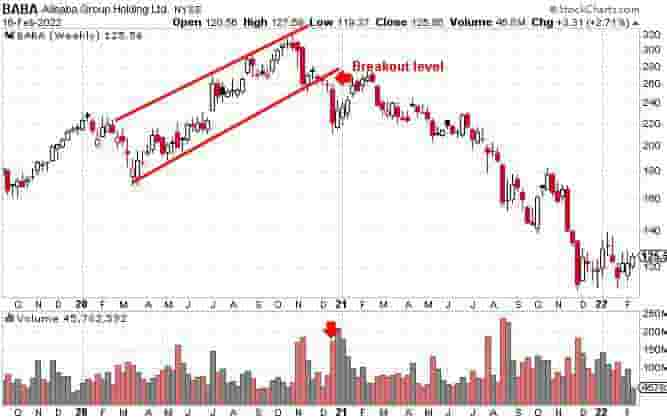
In the above price chart of Alibaba stock, there is a bearish breakout (marked ‘breakout level’).
There is also an increase in volume as annotated by the red arrow. This is a clear example of a bearish breakout. Traders and investors would seek to short when price went below the breakout support level.
Breakout Pros
The breakout pros are listed below.
- Easy To Learn: Most rookie traders will learn how to identify breakouts on price charts in a few days to a few weeks with only the ability to identifty support and resistance levels required for breakout trading
- Helps Capture Large Trend: If the price breaks out successfully, it can be the beginning of quite a substantial trending move, depending on market conditions. Prices passing through breakout levels in certain financial markets can signal the beginning of a 20%, 50% or 100%+ price trending move
- Great Risk/Reward Ratio: Breakouts offer great risk/reward ratio, typically 2.5:1
- Works On All Timeframes: Breakouts work in all timeframes from short term 1-second price chart up to yearly price charts
- Works In All Markets: Breakouts occur in all global markets from stocks, indices, forex, cryptocurrencies, commodities, futures, bonds, ETFs, and options
- Created Many Successful Traders: Breakouts have helped create many successful traders including William O'Neil, Mark Minervini, and Dan Zanger
Breakout Cons
The breakout cons are listed below.
- False Breakout Signals: The price of a financial market can slowly drift above or below a breakout level and then reverse. This can lure a trader into thinking price is breaking out when in fact it is not. This is known as a failed breakout
- Incorrect Support/Resistance Breakout Level Drawing: Many new traders incorrectly draw resistance and support levels, especially those that are new. This can be remedied with more experience.
- Overtrading Issues For Novice Traders: Breakouts can create multiple trading signals and cause overtrading issues for beginner traders
These limitations mean that new traders, investors and technical analysts need to practice trying to spot these breakouts on price charts for some time before getting good at finding them.
Frequently Asked Questions
Below are some frequently asked questions about breakouts in technical analysis.
What’s The Difference Between An All-Time High And A Breakout?
An all-time high in a financial market is when the price of the market reaches an all-time high price.
A breakout in a financial market is when the breakout price breaks out from a predefined support or resistance level. It can breakout to a lower or a higher price.
Do Breakouts Only Occur When Prices Are At A 52 Week High Or Low?
No, breakouts can occur at any price level irrespective of whether the price of the financial market is at a 52-week high level or 52-week low level.
Do Breakouts Occur In All Financial Markets?
A breakout can occur in any financial market that has historical price data. Then, a trader, investor or technical analyst simply needs to monitor these markets to see if a potential breakout is forming.
