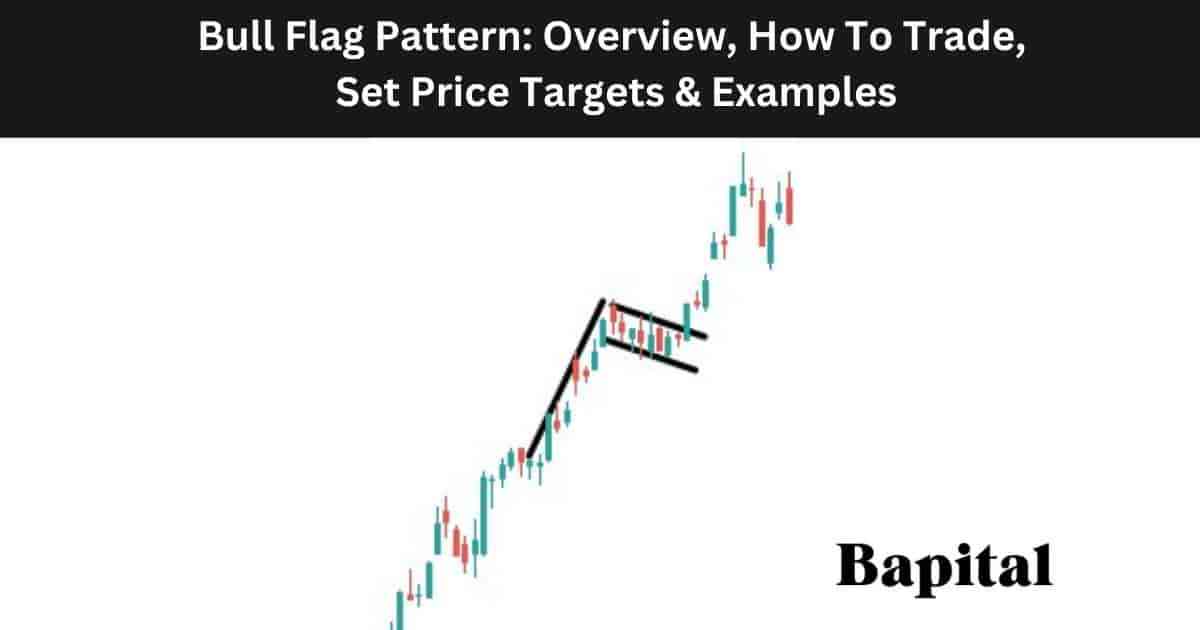
What Is a Bull Flag Pattern In Technical Analysis?
A bull flag pattern is a pattern in technical analysis that signals a potential resumption of an existing bullish uptrend. Bull flags are bullish continuation patterns and they form in the middle of an already established bullish trend. A price breakout from the pattern's resistance level typically results in a sharp upwards price movement. A bullish flag formation gets its name as it resembles a flag with a flagpole shape.
What Is An Alternative Name For A Bull Flag Pattern In Technical Analysis?
A bull flag's alternative name is a "bullish flag pattern" or a "flag pattern".
What Does a Bull Flag Pattern Mean?
A bull flag pattern means the market price of a financial market is in a bullish trend and the market chart is indicating further price increases after a price breakout from the flag's resistance line.
What's The Importance Of a Bull Flag Pattern In Technical Analysis?
The bull flag pattern is important as it helps traders enter a bullish price trend from a low risk entry point and it is important because it signals potentially large upward price trends.
What Is The Opposite Of a Bull Flag Pattern?
The bull flag pattern's opposite is the bear flag pattern which is a bearish signal in the market and is shaped like an inverted bull flag.
Is a Bull Flag Pattern a Continuation or Reversal Pattern?
A bull flag pattern is a bullish continuation pattern that indicates further price trend increases. The bull flag is not a reversal pattern.
What Are The Components Of a Bull Flag Pattern?
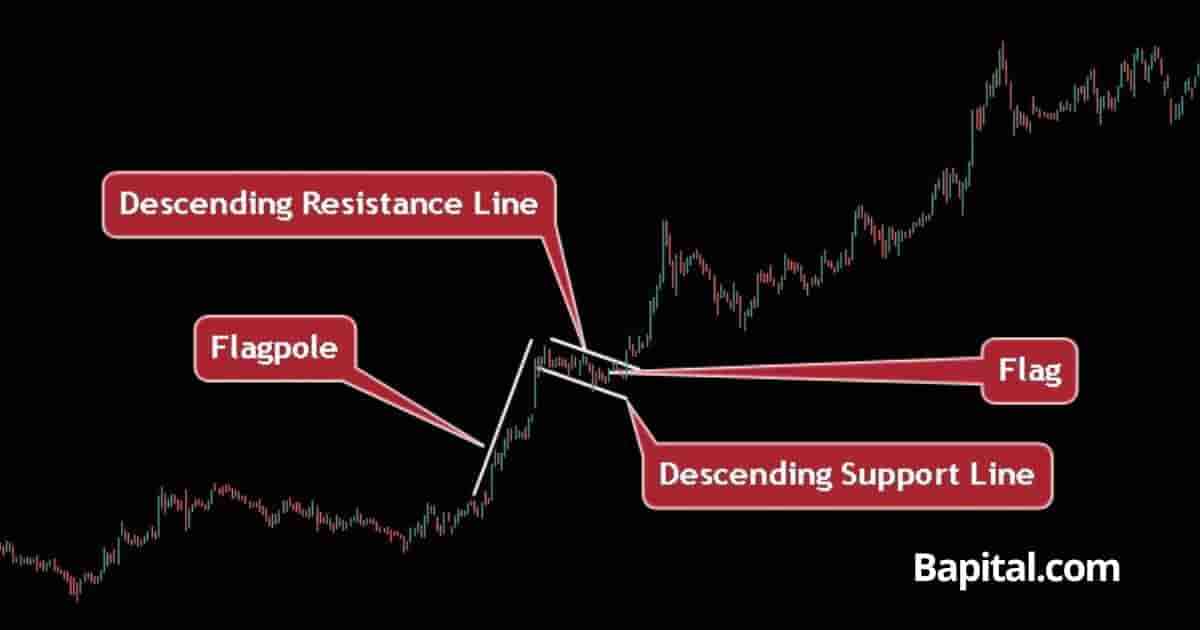
The 5 bull flag pattern components are below.
- Rising Flagpole: This is an uptrend line that illustrates the strong bullish direction of the price of the market. It is called the "flagpole" component of the bull flag
- Flag: There is a rectangular or channel-shaped consolidation area in which the price moves in a narrow range known as the flag. This phase signifies a temporary pause in the market's bullish activity
- Declining Support Level: This is a downtrending support level that connects the swing lows together. This line is where a trader places a stop-loss when trading the bull flag pattern
- Declining Resistance Level: This is a downtrend resistance level of the bull flag that connects the swing highs together. A price break above this level is where a trader places a buy order. This is a parallel trendline to the support trendline
- Price Breakout: The price breakout component sees the market price rise above the resistance point of the pattern on increasing bullish volume. This marks the price entry point for bullish flag pattern traders
What Is The Formation Process Of a Bull Flag Pattern?
The bull flag pattern formation process involves firstly financial market prices rising in a bull trend with the formation of higher swing high prices and higher swing low prices on a price chart. This is the flagpole component and the first part of the formation process of bull flag chart patterns.
The second part of the bull flag pattern formation process involves a price pause after a bull trend with the market consolidating and moving within a sideways price range with two or more swing high prices forming and two or more swing low prices forming. This price range sees the flag component formation.
The third part of the bull flag formation process involves price surging out of the consolidation range and moving higher in a rising trend. This sees the completion of the bull flag formation.
What Happens After a Bull Flag Pattern Forms?
After a bull flag pattern forms, the asset price rises above the pattern resistance point and continues higher in a bullish breakout direction making higher swing lows and higher swing highs.
What Causes a Bull Flag Pattern To Form?
The bullish flag pattern is caused by a temporary price consolidation or pause in an uptrend, typically after a significant price surge. This pattern is characterized by a sharp upward move, known as the flagpole, followed by a brief period of sideways or slightly downward price action, forming a rectangular-shaped flag. The formation of a bull flag is often driven by a market consensus of profit-taking and a natural ebb and flow of buying and selling pressures.
How Long Does a Bull Flag Take To Form?
A bull flag pattern takes a minimum of 28 days to form on a daily timeframe price chart. To calculate the bull flag pattern formation duration, multiple the timeframe used by 28. For example a bull flag pattern on a 30-minute price chart would take a minimum of 840 minutes (30 minutes x 28) to form.
How Often Do Bull Flag Patterns Form?
A bull flag pattern occurs 5 - 8 times per year on a daily timeframe chart in bullish market environments. Shorter timeframe charts under 1 hour price charts sees the bull flag pattern form more often.
What Type Of Price Charts Do Bull Flags Form On?
Bull flags form on candlestick price charts, line charts, bar charts, point and figure charts, and open high low close (OHLC) charts.
What Markets Do Bull Flag Patterns Form In?
Bull flag pattern forms in all global markets including stock markets, future markets, bond markets, commodity markets, options markets, forex markets, and cryptocurrency markets.
What Timeframe Price Charts Do Bull Flag Patterns Form On?
The bull flag pattern forms on all timeframes from short timeframe tick charts up to higher timeframe yearly price charts.
What Is The Most Popular Timeframe To Trade Bull Flag Patterns?
The most popular timeframe to trade a bull flag pattern is the daily price chart as this timeframe is the most reliable with a 63% win probability for the daily timeframe.
What Is The Least Popular Timeframe To Trade Bull Flag Patterns?
The least popular timeframe to trade a bull flag pattern is the 1-second price chart as it generates many false breakouts on this timeframe.
How To Identify a Bull Flag Pattern
To identify a bull flag pattern, traders begin be observing a prevailing bullish uptrend in the market price action. This price surge is the identification of the flagpole. The next part of the bull flag pattern identification is the appearance of the consolidation phase where asset prices move within parallel downtrending trendlines where the support and resistance levels of the pattern are identified. During this price consolidation period, traders look for lower trading volume.
The price coiling up and rising out of the trading range sees the identification of the pattern's breakout point and the completion of the pattern's identity.
How Do Traders Find Bull Flags?
Bull flag formations are found by scanning the financial markets with a bull flag charting screener, checking the online profiles of top traders or expert chartered market technicians (CMT), browsing the market charts manually, or by checking investment broker software.
How Do Traders Draw A Bull Flag Pattern?
A bull flag pattern drawing involves firstly identifying a market uptrend and drawing an upward sloped trendline from bottom to top which marks the flagpole component.
Secondly, draw an upper boundary downward sloping trend line from left to right which connects the swing high points together. This marks the pattern's resistance area component.
Thirdly, draw a lower boundary parallel downward sloping trend line from left to right that connects the swing low points together. This marks the pattern's support area component and the bull flag drawing completion.
How To Trade a Bull Flag Pattern
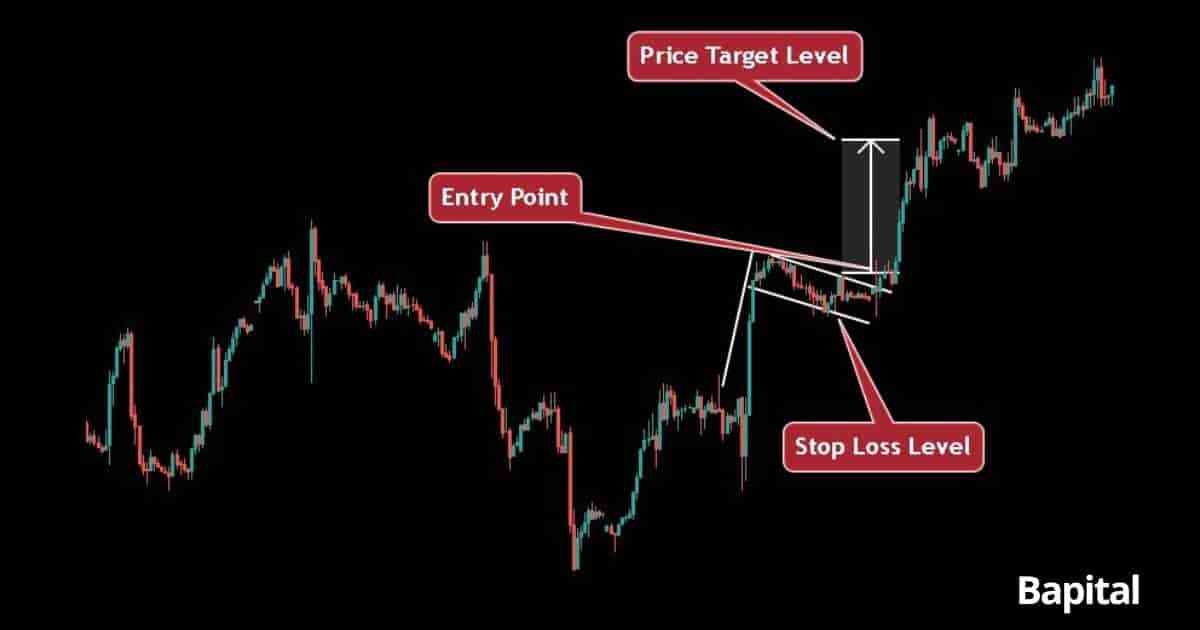
The 4 bull flag pattern trading steps are below.
- Identify the bull flag on a market chart
- Enter buy trade after a price breakout
- Set the bull flag price target order
- Place a bull flag stop-loss order at the pattern support point
1. Identify the Bull Flag On A Price Chart
The first bull flag trading step is to identify the bull flag pattern on a price chart. To identify a bull flag, traders can use a bull flag chart pattern scanner or simply scan capital markets that are in a bullish uptrend and wait for a market consolidation period.
2. Enter Buy Trade After A Price Breakout
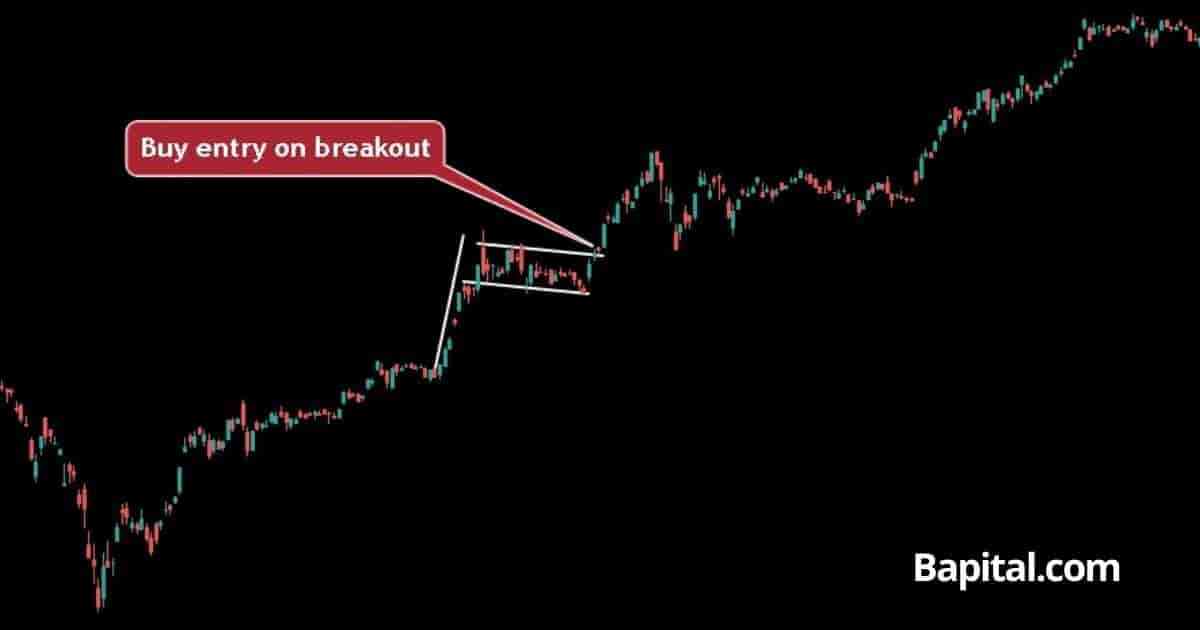
The second bull flag trading step is to enter a long trade position after a price breakout above the pattern resistance area. Analyze the market volume for increasing buyer volume during the price breakout period.
What Is A Bull Flag Entry Point?
A bull flag entry point is when the price penetrates above the declining resistance trendline of the pattern. This is the long entry point for the trade. Watch for increasing buying volume and bullish momentum as the price rises above the resistance line.
3. Set the Bull Flag Price Target Order
The third bull flag trading step is to place a price target order for the trade. Set the price target area by calculating the length in price of the flagpole and then adding this number to the buy entry price.
What Is the Bull Flag Price Target?
A bull flag price target is the area where traders set their profit target when trading a bull flag and it is set by measuring the height of the flagpole component of the pattern and adding this measurement to the breakout price. A higher flagpole measurement means a higher risk/reward ratio as the estimated price target is higher up in price.
For example, if the long entry price is $45 and the flagpole height is $10, the profit target is $55 ($45+$10).
What Is The Bull Flag Pattern Price Target Calculation Formula?
The bull flag pattern price target formula is: Bull Flag Price Target = Buy Entry Price + Flagpole Height.
4. Place a Bull Flag Stop-Loss Order At The Pattern Support Point
The fourth bull flag trading step is to place a stop-loss order below the swing low price of the pattern support level. Traders use either a stop market order or stop limit order to protect their capital and manage risk.
What Is The Risk Management Of A Bull Flag?
A bull flag pattern risk management is set by placing a stop-loss order below the swing low of the declining support trendline of the pattern. Traders typically risk 1% of trading capital when trading bull flags and adjust their position size to represent this risk amount. A stop-loss protects against false trading signals and minimizes capital loss.
What Is The Risk/Reward Ratio When Trading Bull Flag Patterns?
A bull flag pattern risk/reward ratio is 3:1 (risk $1 to return $3+).
What Is a Bull Flag Pattern Trading Strategy?
A bull flag pattern trading strategy is the U.S. equities bull flag breakout strategy. Scan the markets for bullish price trends of 12%+. Watch for a bull flag to form in these bullish trending markets. Enter a buy trade position when the price breaks out of the pattern on increased buying pressure (green volume bars).
Set a trailing stop loss order along the 10 exponential moving average. When the price candlestick closes below the 10EMA, close the trading position. Set the position size to 1% of trading capital. Do not apply this trade strategy before or during important economic and political news announcements.
What Type Of Trading Strategies Can Bull Flags Be Traded In?
Bull flags can be applied to scalping strategies, day trading strategies, swing trading strategies, and position trading strategies.
What Are Bull Flag Pattern Trading Rules?
The bull flag pattern trading rules are below.
- Risk a maximum of 1% of trading capital per trade
- Enter a long position on a price breakout only
- Avoid trading the pattern in choppy sideways volatile price action
- Monitor for increasing buyer volume as price breaks out
- Avoid trading bull flags prior to or during important market news events
What Are Common Mistakes When Trading Bull Flags?
Bull flag pattern trading mistakers include risking more than 1% trading capital per trade, trading the chart pattern in illiquid markets, trading during extreme volatile market periods, and trading during important corporate, economic, and politcal news annoucements.
What Are The Risks Of Trading a Bull Flag?
The bull flag pattern trading risks are the market price gapping down and multiple pattern fakeouts causing substantial trading losses.
What Types Of Traders Trade Bull Flags?
The bull flag pattern traders include scalpers, day traders, swing traders, position traders, professional technical analysts, and active investors.
What Top Trader Trades Bull Flags?
The top bull flag pattern trader is swedish trader Kristjan Kullamägi who turned a few thousand dollars to over $100 million since 2011 trading bull flags and other similar chart patterns.
What Are Examples Of Bull Flag Patterns?
Bull flag historical chart pattern examples are displayed below.
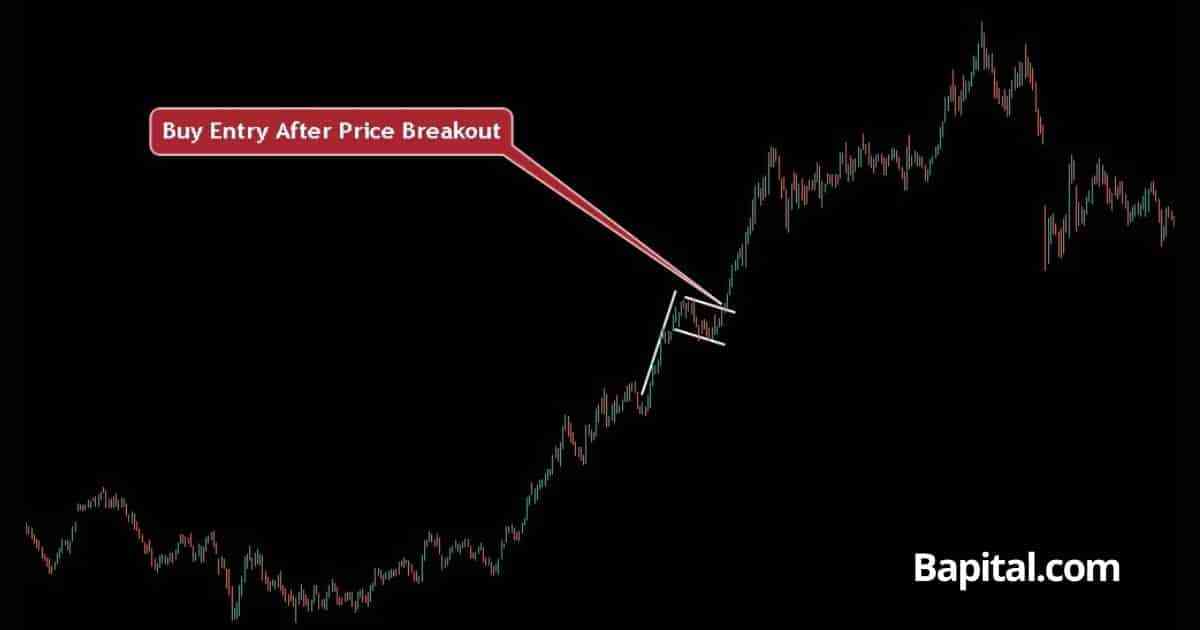
Bull Flag Stock Market Example
A bull flag pattern stock market example is illustrated on the daily price chart of Tesla stock (TSLA) above. The stock price rises in a bullish trend before a swing high price pullback and consolidation. A price breakout occurs from the pattern after the consolidation phase leading to upward price movement in a strong uptrend over the next three months.
Bull Flag Forex Market Example
A bull flag pattern forex market example is shown on the weekly price chart of GBP/USD forex currency pair above. The currency price rises in an upward direction before consolidating in a price range between two parallel support and resistance levels. The price breaks out and moves higher until it reaches the trade exit point.
Bull Flag Short Timeframe Example
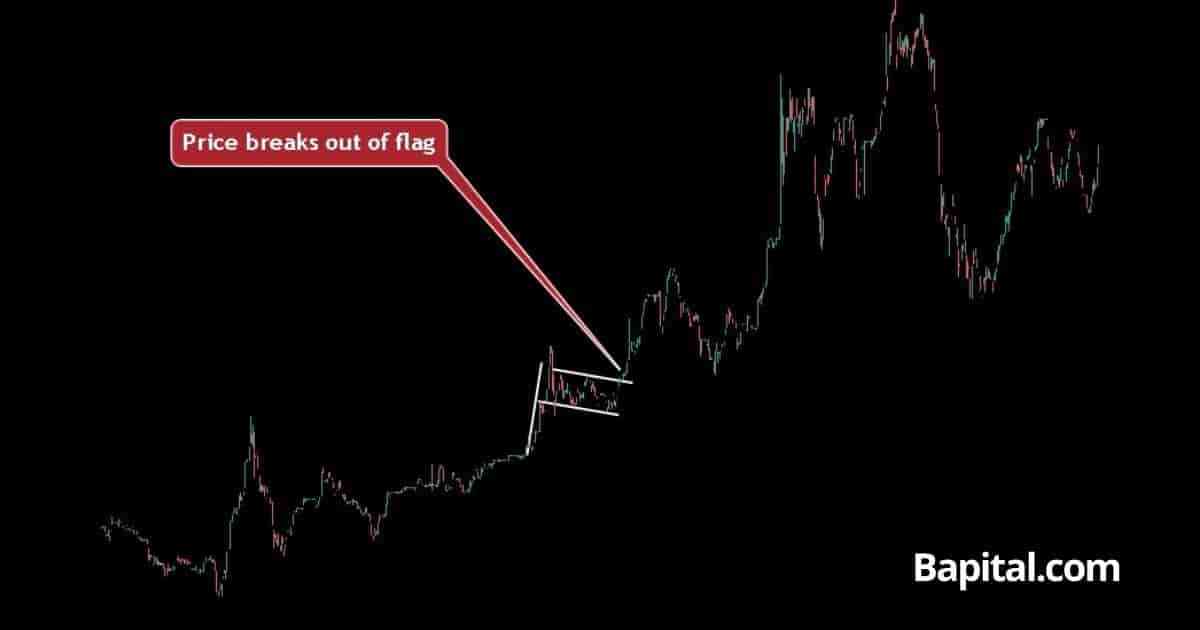
A bull flag pattern short timeframe example is shown on the 1-minute price chart image of Bitcoin above. The Bitcoin price initially moves up which forms the flagpole component of the pattern. Price consolidates for 35 minutes in a narrow low volatility range before breaking out of the range and continuing higher in a bullish trend to reach the target profit level.
Bull Flag Higher Timeframe Example
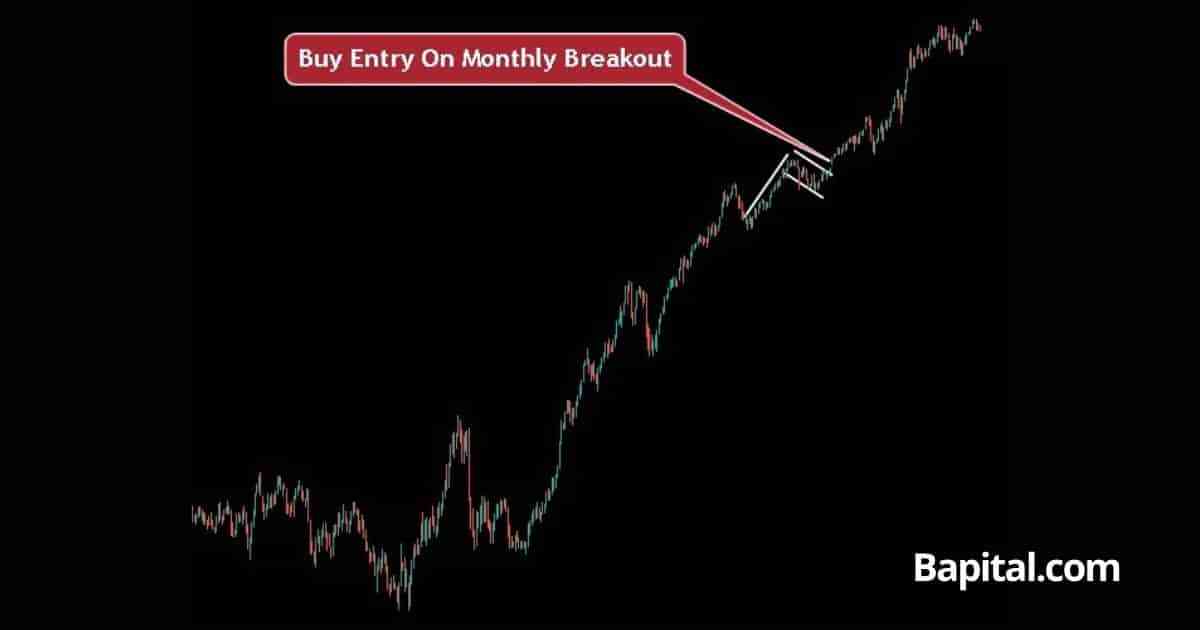
A bull flag pattern high timeframe example is illustrated on the monthly stock chart of Apple stock (AAPL) above. The Apple stock price intially moves in a bull trend over multiple months which forms the flagpole. The price starts a consolidation period over 14 months which forms the flag component. The price rises above the resistance line and trends higher to the upside before reaching the trade target level.
What Is a Bull Flag Pattern Failure?
A bull flag pattern failure, also known as a "failed bullish flag", is when a bull flag forms but fails to continue higher in price. The bull flag pattern is invalidated and fails when the asset price rises and breaks out above the breakout entry price in a bullish movement but quickly reverses from above the resistance area to trend lower below the pattern's support level in a bearish direction. A failed bull flag is a bearish signal.
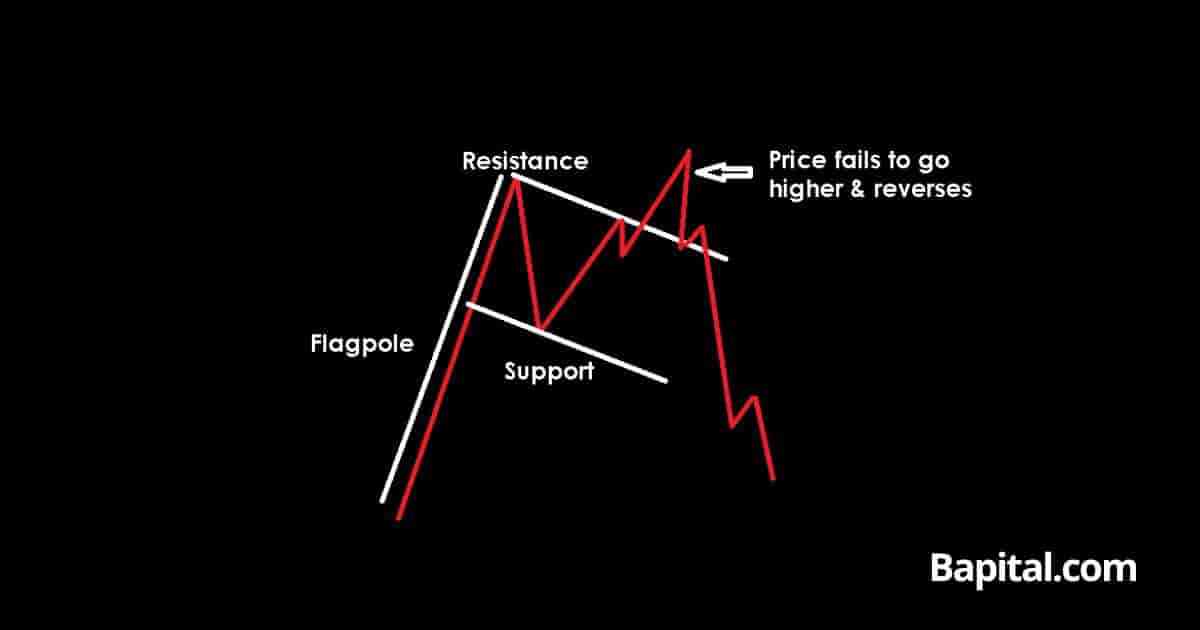
What Causes a Bull Flag Pattern To Fail?
The bull flag pattern failure causes are below.
- Lack Of Buying Volume: A lack of buying volume when the price of a market breaks out of the bull flag can cause a bull flag pattern to fail. If there is only a few buyers after the market breaks out, this can be an indication that traders are not confident in the market trending higher and instead believe there will be a failure after the price breakout
- Negative Market News: Negative economic or political news can cause the price of a market to reverse from bullish to bearish and cause a failure
- Major Resistance Level: A major resistance level above the bull flag pattern can mean the market will struggle to go higher. This can mean the bull flag will fail at the major resistance level and reverse to lower levels
What Are The Benefits Of a Bull Flag Pattern?
The bull flag pattern benefits are listed below.
- Helps Identify Bullish Price Movement: One of the primary benefits of mastering the bull flag pattern is its ability to act as a leading indicator. By identifying this pattern, traders can forecast potential price surges and bullish trends in a market before they happen. This not only aids in making informed trading decisions but also allows traders to ride the wave of upward bullish momentum
- Great Reward-Risk Ratio: A bull flag pattern offers a great reward to risk ratio, typically risking $1 to make $3+. This pattern often presents a well-defined entry point and a nearby stop-loss level. The clear risk management structure allows traders to take calculated risks, aiming for substantial rewards. It's a tool that can potentially maximize gains while keeping losses in check
- Universal Market Applicability: Bull flags work in all global market including stocks, commodities, forex, bonds, futures, options, indices, and cryptocurrencies. This versatility enables traders to capitalize on opportunities across a diverse range of financial instruments
- Universal Timeframe Applicability: Bull flags work in all timeframes from short term tick charts to long term monthly and yearly price charts making it applicable to both short term trading strategies and long term trading strategies
What Are The Limitations Of a Bull Flag Pattern?
The bull flag pattern limitations are below.
- False Breakouts: A bull flag pattern can fail and a trader should expect this to happen by setting stop-losses to manage risk when the pattern fails
- Identifying Pattern Challenges: One common limitation is that novice traders may struggle with accurately identifying the bull flag pattern. Identifying the precise levels for the flagpole, support, and resistance lines can be challenging. This difficulty can potentially lead to misinterpretation and trading errors
- Negative External Factors: The effectiveness of a bull flag pattern can be influenced by broader market conditions, news events, and economic factors. External forces can disrupt the pattern's anticipated outcome, making it important for traders to stay informed about the market environment
What Technical Indicators Are Used With Bull Flag Patterns?
A bull flag pattern is used with technical indicators including the exponential moving average overlay, volume indicator, volume weighted average price (VWAP), relative strength index (RSI) trading indicator, average daily range, and bollinger bands in technical analysis.
What Is The Most Popular Technical Indicator Used With Bull Flags?
The bull flag pattern most popular indicator is the volume indicator as it indicates the pattern breakout strength when asset prices move out of bull flag in a bull direction.
What Is The Least Popular Technical Indicator Used With Bull Flag Patterns?
The bull flag pattern least popular indicator used is the ichimoku cloud as this indicator can cause confusion when used in conjuction with bull flag patterns.
What Technical Indicator Is Used As A Confirmation Signal With a Bull Flag?
The bull flag pattern confirmation technical indicator is the volume indicator as it confirms whether their are large buyers after a pattern breakout.
What Is The Psychology Behind a Bull Flag Pattern?
The psychology of a bull flag pattern is rooted in market participants' behavior with a strong surge in buying activity creating the flagpole, reflecting optimism and confidence in the asset. As prices reaches higher levels, traders decide to take profits, resulting in a consolidation or price retracement. This profit-taking phase introduces an element of caution and a desire to secure gains among market participants. However, the overall sentiment remains positive, with traders viewing the consolidation as a temporary price pause rather than a shift in trend.
The flag formation represents a balance between profit-taking and sustained bullishness. During this period, traders assess the strength of the underlying trend, preparing for a potential continuation of the upward movement. The psychology underlying the bull flag is a balance between profit realization and the expectation of further price appreciation, contributing to the pattern's significance in technical analysis.
When Are Traders Optimistic During the Bull Flag Pattern Formation?
Traders are optimistic during a bull flag pattern formation when the market security is breaking out on increasing buyer volume in an uptrending direction. Traders are optimistic during the pattern breakout phase as they anticipate much higher market prices and more profits for their bullish trades.
What Are The Statistics Of a Bull Flag Pattern?
The bull flag pattern statistics are illustrated on the table below.
How Accurate Is a Bull Flag Pattern?
A bull flag pattern accuracy is 63% according to the book, "Encyclopedia of Chart Patterns", by Thomas Bulkowski.
What Timeframe Has The Highest Bull Flag Pattern Win Rate?
The bull flag pattern highest win rate timeframe is the weekly timeframe price chart with a 65% average win rate.
What Timeframe Has The Lowest Bull Flag Pattern Win Rate?
The bull flag pattern lowest win rate timeframe is the 1-minute price chart with a 54% average win rate.
Is a Bull Flag Pattern Reliable?
Yes, bull flags are reliable if they are traded correctly with the right trading rules applied. Higher timeframe bull flags are more reliable with a 65% win rate on the weekly chart compared to a 54% win rate on shorter term 1-minute timeframe price charts.
Research from Decision Support Systems, Volume 32, Issue 4 titled "Forecasting the NYSE composite index with technical analysis, pattern recognizer, neural network, and genetic algorithm" concluded that:
The bull flag price and volume pattern heuristic effectively predicts stock market movements using technical analysis, machine learning, and soft computing techniques.
This is evidence of the bull flags reliability in capital markets.
What Market Conditions Is a Bull Flag Most Reliable?
A bull flag is most reliable in bullish trending market conditions with prices appreciating.
What Market Conditions Is a Bull Flag Pattern The Least Reliable?
A bull flag is the least reliable in bearish trending market conditions and choppy rangebound market conditions.
Is a Bull Flag Pattern Profitable?
Yes, a bull flag pattern is profitable as the average success rate is 63% and the average return to risk ratio is 3 to 1. This means for every 100 trades, a trader wins 63 trades making 3 units (189 units total) and loses 37 trades losing 1 unit (37 units total). Therefore, over 100 trades, a trader should hypothetically net 152 units (189 units - 37 units). Be aware that past performance is not indicative of future results.
How Can Traders Make a Bull Flag Pattern More Profitable?
A trader can make a bull flag more profitable by trading the pattern on higher timeframe price charts over the daily market charts as the longer timeframe charts have a higher win probability.
What's The Difference Between a Bull Flag vs Bear Flag Pattern?
The bull flag pattern differences with a bear flag pattern are what it indicates and its shape. A bull flag pattern is a bullish indicator while a bear flag pattern is a bearish indicator. A bull flag pattern is shaped like a flag with a flagpole while a bear flag pattern is shaped like a flag with flagpole turned upside down.
What's The Difference Between a Bull Flag vs Bullish Pennant Pattern?
The bull flag pattern difference with a bullish pennant pattern is its shape. A bull flag pattern has parallel downtrending resistance and support lines while a bullish pennant has a downward sloping resistance level and an upward sloping support line.
What Are Alternatives To Bull Flag Patterns?
The bull flag pattern alternatives are listed below.
- Cup with handle pattern
- Inverted head and shoulders pattern
- Falling wedge chart pattern
- Double bottoms
- Diamond bottoms
- Triple bottoms
- Price channel pattern
- Bullish pennant pattern
What Is The Most Popular Bull Flag Pattern Alternative?
The bull flag pattern's most popular alternative is the bullish pennant pattern which is a bullish signal.
What Are Bull Flag Pattern Resources To Learn From?
Bull flag pattern resources to learn from include books, websites, and courses.
What Are Books To Learn About Bull Flag Patterns?
Books to learn about bull flags are "Technical Analysis of Financial Markets" by technical analyst John Murphy, "Encyclopedia of Chart Patterns", by Thomas Bulkowski, and "The Ultimate Guide to Chart Patterns by Steve Burns and Atanas Matov.
What Are Websites To Learn About Bull Flag Patterns?
Websites to learn about bull flags are Bapital.com, Investopedia.com, and Stockcharts.com.
What Are Courses To Learn About Bull Flag Patterns?
Courses to learn about bull flag patterns are "The Ultimate Chart Patterns Trading Course" by Rayner Teo and "Stock & Forex Trading With Chart Pattern Technical Analysis" by NISM certified technical analyst & investment adviser Jyoti Bansal.
What Are The Key Facts Of a Bull Flag Pattern?
The bull flag pattern key facts are below.
