What Are Candlestick Patterns?
In technical analysis, candlestick patterns are graphical candlestick formations and specific and identifiable shapes found only on Japanese candlestick charts that help analyze the price action of a financial market and predict the future price movements in a market.
These candlestick patterns tend to repeat themselves on candlestick charts and traders believe these patterns can help them to understand the market environment.
A candlestick pattern can form on just one candlestick or over a group of candlesticks combined.
Candlestick Pattern Components
In order to find candlestick patterns, a trader will need access to Japanese candlestick charts.
The components of a candlestick pattern include:
- Open price
- Close price
- High price
- Low price
- A distinct and repeatable candlestick shape or formation
A candlestick pattern can only form once the above information is available.
Types Of Candlestick Patterns
There are many different types of candlestick patterns found on candlestick charts.
Types of candlestick patterns include:
- Hammers: These are bullish and bearish candlestick patterns shaped like a "hammer".
- Engulfing Candlesticks: These are a 2 bar candlestick pattern formation that indicates market reversals.
- Piercing Line: These are another type of 2 bar candlestick pattern formation that can indicate price reversals.
- Morning Star: This is a bullish candlestick pattern that forms over 3 candlestick bars.
- Three White Soldiers: These are bullish candlestick patterns that help traders spot potential reversal of downtrends in the market.
- Hanging Man: This is a bearish candlestick pattern typically found at the end of an up-trending market.
- Shooting Star: This is a bearish candlestick pattern that forms from near resistance levels or at the end of a bullish trend.
- Evening Star: This is a bearish candlestick pattern that can form when the price of a market gaps up into a resistance area or gaps up at the end of a bullish trend.
- Dark Cloud Cover: This is a candlestick pattern that signals a price reversal from bullish to bearish. It forms over 2 candlesticks.
- Three Black Crows: These are bearish candlestick patterns that form over 3 price candles.
- Spinning Top: This is a candlestick pattern that indicates indecision in the future direction of the price of the market
- White Marubozu: This is an extremely bullish candlestick pattern that forms when buyers control a market from the opening bell to the close.
- Three Inside Up: This is a bullish reversal price chart pattern that forms over 3 price candlesticks.
- Tweezer Bottom: This is a short-term bullish reversal candlestick pattern that indicates a market bottom.
These are just some of the most popular candlestick patterns used by traders and technical analysts.
Candlestick Patterns Examples
Below are visual examples of different candlestick patterns found on Japanese candlestick charts.
Example Of A Hammer Candlestick Pattern
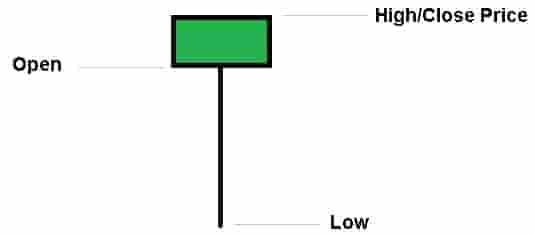
The hammer pattern is shaped like an actual "hammer".
The candlestick shows that the prices of the market attempted to push lower but rejected the lower levels and traded back to the opening prices.
Example Of An Engulfing Candlestick Pattern
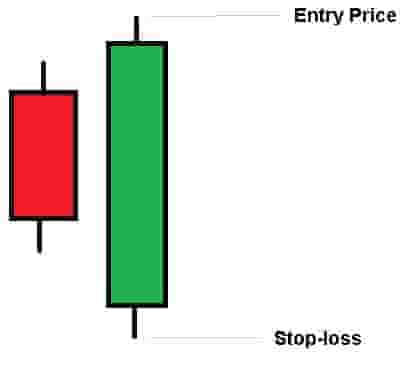
The engulfing candlestick pattern is a 2 candlestick pattern formation.
It can form as a bullish or bearish engulfing candlestick pattern.
This engulfing candlestick pattern forms when the second candlestick either gaps down or up from the closing price and then that second candlestick completely engulfs the first candlestick.
Example Of A Piercing Line Candlestick Pattern
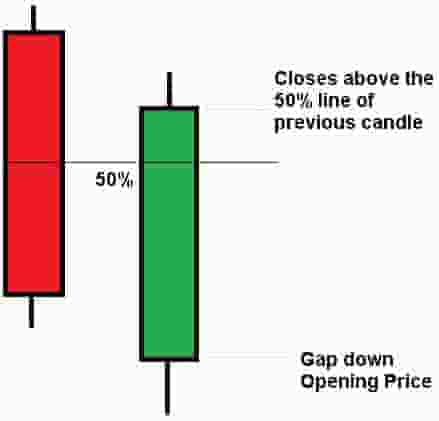
The piercing line candlestick pattern forms over 2 price candles. it can signal a price trend reversal.
It can form as a bullish signal or a bearish signal.
It forms when the price of the candle gaps up/down from the previous candlestick and closes above/below the 50% line of the previous candlestick.
Example Of A Morning Star Candlestick Pattern
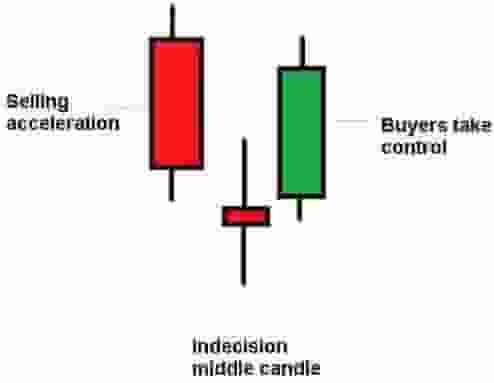
A morning star is a 3 candlestick pattern that signals potential bullish price action in a financial market.
Example Of A Three White Soldiers Candlestick Pattern
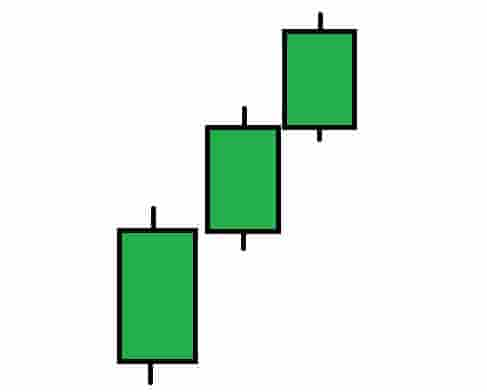
The three white soldiers candlestick pattern is a bullish signal in the markets.
It is used to help identify reversals of a price downtrend. It consists of 3 large body bullish candlesticks.
Example Of A Hanging Man Candlestick Pattern
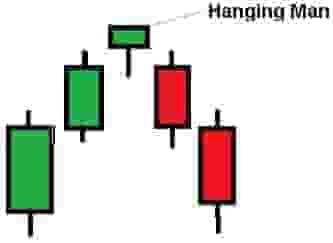
The hanging man is a bearish candlestick pattern that signals a potential reversal of a bullish price trend.
It forms when the price gaps up and creates a small body with a long lower wick. It is just one candlestick.
Example Of A Shooting Star Candlestick Pattern
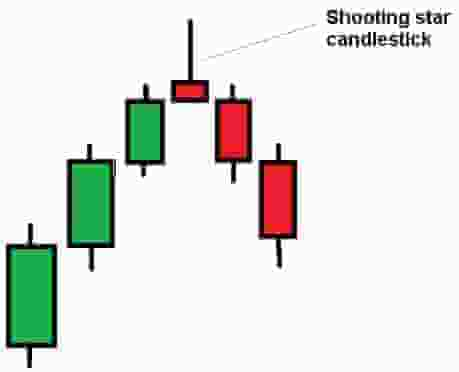
A shooting star candlestick pattern is a bearish candlestick pattern that forms at the end of a bullish price trend.
It forms when there is a small body with a long upper wick on the candlestick.
Example Of An Evening Star Candlestick Pattern
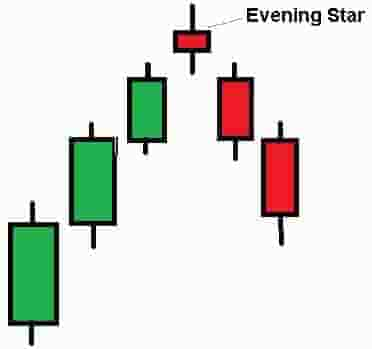
The evening star is a candlestick pattern that indicates a potential price reversal from a bullish trend to a bearish trend. It forms at the end of an uptrend.
The pattern forms over 3 candlesticks. The first is a bullish candlestick, the second is a smaller gap up bullish candlestick and the third is a price gap down and bearish candlestick.
Example Of A Dark Cloud Cover Candlestick Pattern
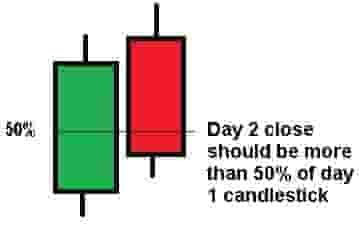
A dark cloud cover is a candlestick pattern that indicates a price reversal from a bullish to a bearish price trend.
It is composed of two candlesticks, the first is a bullish candlestick and the second is a bearish one.
The second candlestick gaps up and opens higher than the first candlesticks closing price and then trades lower. The second candlestick must close at 50% or more below the first candlestick in order for this pattern to form.
Example Of A Three Black Crows Candlestick Pattern
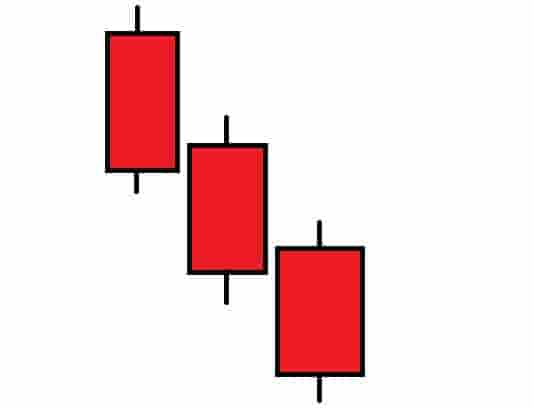
The three black crows pattern is a bearish candlestick pattern that signals the reversal of a bullish price trend.
It is composed of three bearish price candles in a row, typically with a large bearish body on each candlestick.
Example Of A Spinning Top Candlestick Pattern
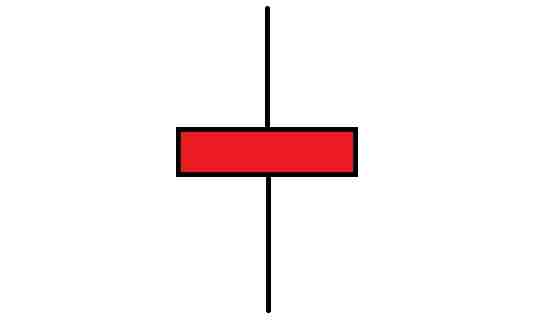
A spinning top is a candlestick pattern that indicates there is indecision in the market with neither buyers or sellers in control.
It forms when there is a very small body area with two long wicks on either side of the body of the candlestick.
Example Of A White Marubozu Candlestick Pattern
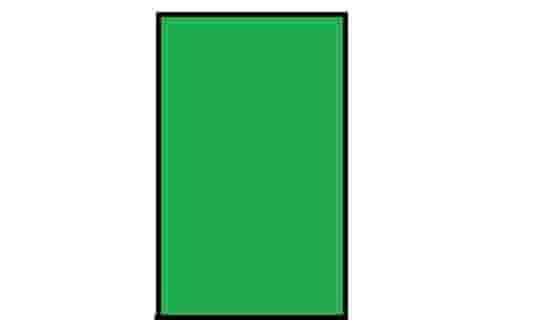
The white marubozu is a bullish candlestick pattern that indicates that buyers are very strong in the market.
It typically is displayed as a large body area with the closing price of the candlestick at the price high.
Example Of A Three Inside Up Candlestick Pattern
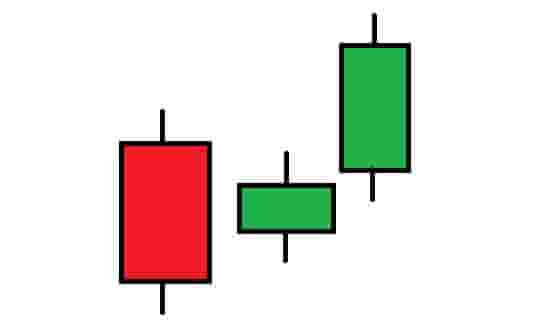
The three inside up is a bullish reversal candlestick pattern composed of 3 candlesticks.
The first candlestick is a large downward candlestick with a large body area.
The second candle is a smaller bullish candlestick inside the first candlestick and the third candlestick is a bullish candle that closes above the high of the first candlestick.
Example Of A Tweezer Bottom Candlestick Pattern
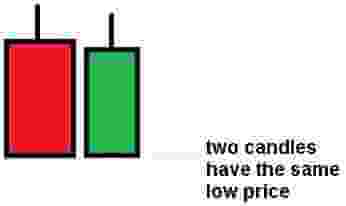
The tweezer bottom pattern is a short-term bullish reversal pattern that forms in downtrending markets.
It is composed of two candlesticks, one bearish and one bullish candle. The low price of both candlesticks are the exact same.
Candlestick Pattern Timeframes
Candlestick patterns can form on any timeframe on a candlestick price chart.
The timeframes that are most popular for finding candlestick patterns include:
- 1-minute charts: Scalpers and intraday traders will look for candlestick patterns on lower timeframe charts like the 1-minute. Keep in mind that the lower timeframe candlestick patterns tend to be less reliable.
- 1-hour charts: Day traders use the hourly candlestick charts to find candlestick patterns.
- Daily charts: Swing traders use daily timeframe candlestick charts to find candlestick patterns.
- Weekly charts: Swing traders also use weekly timeframe candlestick charts to find candlestick patterns.
- Monthly charts: Longer-term traders use monthly candlestick charts to find candlestick patterns.
Candlestick patterns tend to be more reliable on the higher timeframe charts over the shorter timeframe price charts.
Candlestick Patterns Benefits
The benefits of candlestick patterns are:
- They offer clear trade signals:Candlestick patterns offer clear buying and shorting triggers with easily identifiable buying and shorting entry prices.
- They offer a great reward to risk ratio: Candlestick patterns can offer a high reward to risk ratio meaning traders can be profitable with a lower win rate.
- They can be applied to any financial market: Candlestick patterns can be found in any financial market with historical price data, e.g. stocks, commodities, forex etc.
These advantages make learning about candlestick patterns useful for traders.
Candlestick Patterns Limitations
The limitations of candlestick patterns include:
- They can only be applied to candlestick charts:Candlestick patterns can only form on Japanese candlestick charts.
- They can create many false signals: Candlestick charts can offer many false signals for traders.
- They are much more unreliable on shorter timeframe charts: Candlestick patterns are more unreliable on lower timeframe price charts.
These are the main drawbacks of candlestick patterns that every trader should be aware of.
Differences Between Candlestick Patterns vs Chart Patterns
The differences between candlestick patterns and chart patterns are:
- Candlestick patterns can only form on Japanese candlestick price charts whereas chart patterns can form on any price chart from a line chart to a point and figure chart.
- There are hundreds of candlestick patterns whereas there are a few dozen chart patterns to learn.
- The focus of candlestick patterns is on the individual shapes of the candlestick price "candles" whereas the focus of chart patterns is on a collection of price bars combined.
These are the three main differences between candlestick patterns and chart patterns.
