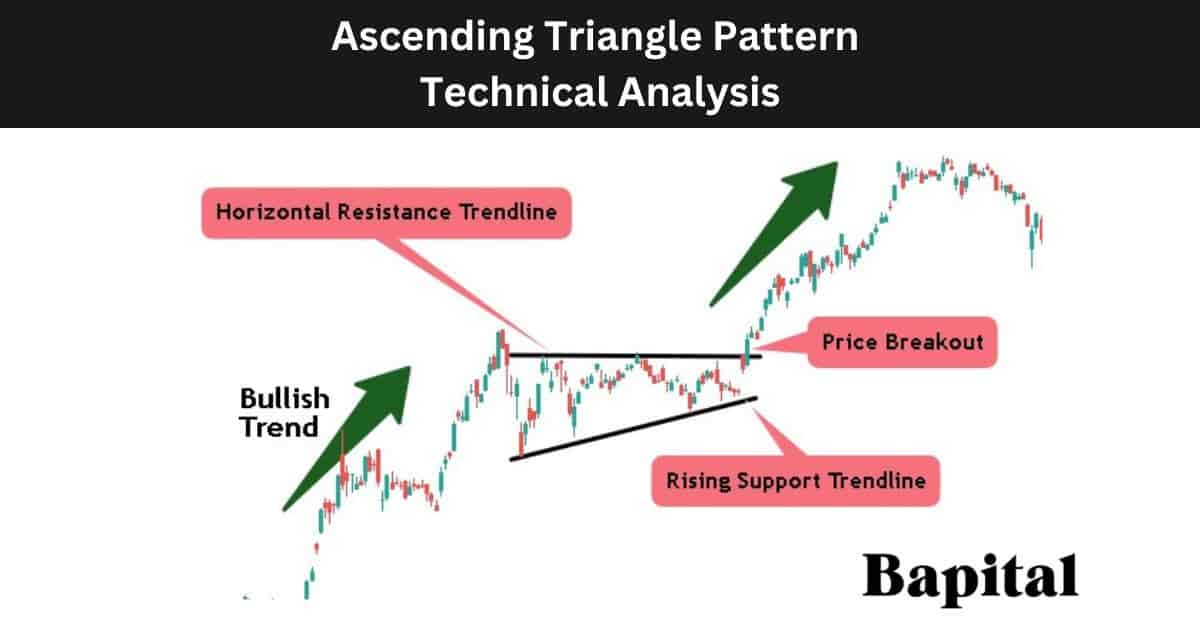
What Is an Ascending Triangle Pattern In Technical Analysis?
An ascending triangle pattern is a bullish pattern in technical analysis that signals the market price will increase after an upside price breakout. Ascending triangles are mainly a bullish continuation pattern but they are used as bullish reversal patterns on very rare occasions. Ascending triangle patterns are considered a continuation pattern when they form during an already established uptrend and they are considered a reversal pattern when they form at the end of a bearish downtrend.
What Is An Alternative Name For An Ascending Triangle Pattern?
An ascending triangle pattern's alternative name is a "rising triangle".
What Does An Ascending Triangle Pattern Mean?
An ascending triangle pattern means bullish price movement in market assets is imminent if the price breaches the overhead resistance supply line.
What Is The Importance Of an Ascending Triangle Pattern In Technical Analysis?
The ascending triangle pattern is important as it offers a low risk buy entry point for traders lookign to capture bullish price trends and it is important for providing price action clarity to traders.
What Is The Opposite Of an Ascending Triangle Pattern?
The ascending triangle pattern's opposite is the descending triangle pattern which is a bearish pattern.
What Are Other Types Of Triangle Patterns?
The two other triangle pattern types are the symmetrical triangle pattern and the descending triangle pattern.
What Are The Components Of an Ascending Triangle Pattern In Technical Analysis?
The 5 ascending triangle components are a bullish price trend, price consolidation, horizontal resistance line, upward-sloping support line, and a pattern price breakout.
1. Bullish Price Trend
The ascending triangle bullish price trend component is when a market asset is in bullish and rising trend with prices making higher highs and higher lows.
2. Price Consolidation
The ascending triangle price consolidation component occurs when price pauses in a bull trend and starts to fluctuate and temporariliy move sideways.
3. Horizontal Resistance Line
The ascending triangle horizontal resistance level component is a straight horizontal line drawn across the price peaks or swing highs on a price chart. It represents the level where traders will look for buy trade opportunities once the price breaks out above it.
4. Upward-Sloping Support Line
The ascending triangle upward-sloping support trendline component is a diagonal line drawn from left to right that connects the the higher lows (swing lows) together. It represents the rising level where there is an increase in buying interest.
5. Price Breakout
The ascending triangle price breakout componenet is when the asset price rises above the resistance level on rising buyer volume.
What Is The Formation Process Of an Ascending Triangle Pattern?
The ascending triangle pattern formation process begins with a bullish trend in the market asset with price appreciation. After the bullish trend, a small price retracement occurs with the market price fluctuating between a resistance area of relatively equal height and a support area with rising swing low prices.
What Happens After an Ascending Triangle Pattern Forms?
After an ascending triangle pattern forms, the market price penetrates above the resistance market top line and continues rising in a bullish direction with increasing prices.
What Causes an Ascending Triangle To Form?
The ascending triangle pattern is caused by a period of accumulation where buyers absorb selling pressure. The horizontal resistance level indicates a point at which sellers are active but the ascending triangle pattern implies that buyers are gradually overcoming this seller resistance area with a build up of pullbacks being bought aggressively prior to a bullish breakout. The narrowing price range within the pattern signals decreasing volatility and an imminent breakout. When the price breaks above the horizontal resistance, usually accompanied by increased trading volume, it confirms the pattern's completion and signifies a potential upward price surge.
How Long Does An Ascending Triangle Take To Form?
The ascending triangle pattern formation duration ranges from 60 minutes plus on a 1-minute price chart up to 60 years and more on a yearly price chart. To calculate the ascending triangle pattern formation duration, multiple the timeframe used by 60. For example, an ascending triangle on a 15-minute timeframe chart would take a minimum of 900 minutes (15 minutes x 60) to form.
How Often Do Ascending Triangle Patterns Form?
The ascending triangle forms between 7 and 10 times per year on daily price charts depending on the market environment. Shorter timeframe price charts under the daily timeframe sees the pattern form more frequently.
What Type Of Price Charts Do Ascending Triangles Form On?
Ascending triangles form on candlestick price charts, line charts, bar charts, point and figure charts, open high low close (OHLC) charts, area charts, and heikin ashi charts.
What Markets Do Ascending Triangle Patterns Form In?
The ascending triangle forms in all global financial markets including stock markets, future markets, bond markets, commodity markets, options markets, forex markets, and cryptocurrency markets.
What Timeframe Price Charts Do Ascending Triangle Patterns Form On?
The ascending triangle pattern forms on all timeframes from short term 1-second charts to longer term yearly charts.
How To Identify an Ascending Triangle Pattern?
The ascending triangle pattern identification begins with identifying a market uptrend with rising prices. Ascending triangles typically form within the context of an existing price uptrend. Confirm that there is a clear upward price movement before the pattern begins to take shape.
Identify a horizontal resistance line that connects at least two highs points where the price has struggled to move higher. This line forms the ascending triangle's upper boundary resistance area.
Identify a rising trendline that connects at least two higher lows points where the price has consistently risen. This line forms the ascending support and lower boundary of the triangle.
As the price continues to move within the pattern, it forms a triangular shape with a flat upper trendline and a rising lower trendline. The two trendlines convergence creates the ascending triangle pattern.
How Do Traders Find Ascending Triangles?
Ascending triangle formations are found by scanning the financial markets with an ascending triangle scanner, checking the online profiles of top traders or expert chartered market technicians (CMT), browsing the price charts manually, or by checking broker software.
How Do Traders Scan For an Ascending Triangle Pattern?
Ascending triangle pattern scanning involves traders using Finviz.com chart pattern scanner to find ascending triangles or using trading broker chart pattern screeners to scan for ascending triangles.
How Do Traders Draw an Ascending Triangle Pattern?
The ascending triangle pattern drawing begins firstly with the resistance zone. Draw a horizontal trend line (flat top) from left to right connecting the swing high price peaks together in a straight line. The swing high price points should be of approximately equal price.
Secondly, draw a rising support trend line from left to right connecting the higher swing low trough prices together. Each support point should be higher than the previous support point.
How To Trade an Ascending Triangle Pattern
The ascending triangle pattern trading steps are listed below.
- Identify the ascending triangle in a financial market
- Enter a buy trade when the price breaks above the resistance area
- Set the ascending triangle price target order
- Place a stop-loss order below breakout candlestick price low
- Conduct Post Trade Analysis
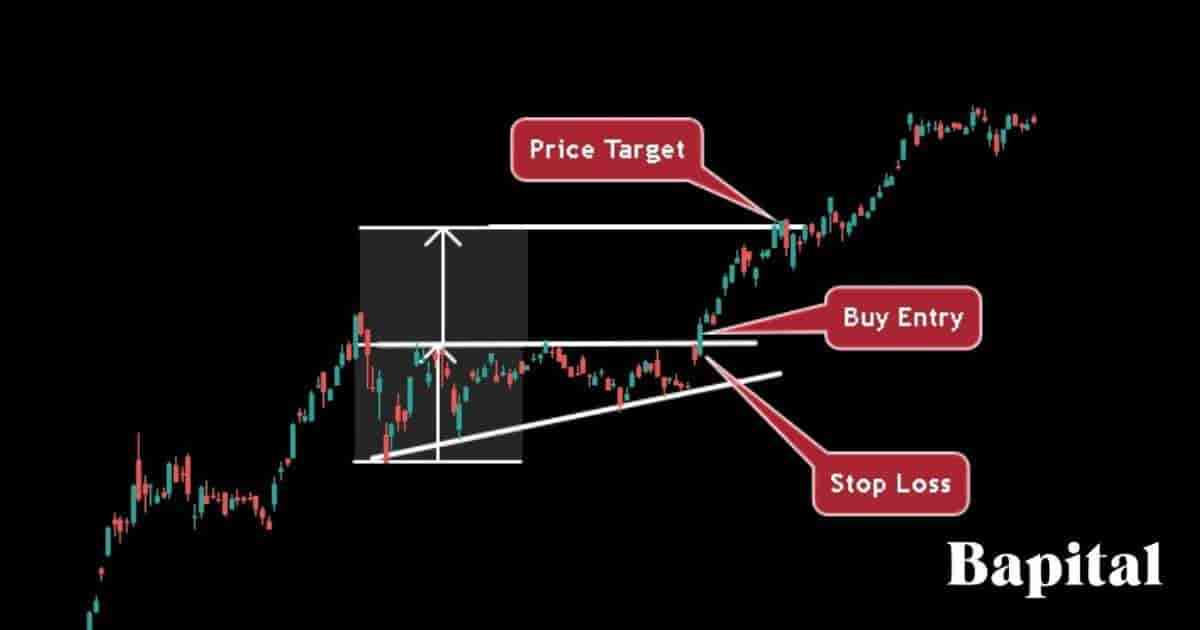
1. Identify The Ascending Triangle In A Financial Market
The first ascending triangle pattern trading step is to identify the pattern on a market chart. Use a scanner to identify the pattern or browse through price charts manually.
2. Enter A Buy Trade When The Price Breaks Above The Resistance Area
The second ascending triangle pattern trading step is to enter a buy trade position when the market price pushes above the resistance trendline on rising bullish volume.
What Is an Ascending Triangle Breakout Entry Point?
An ascending triangle pattern breakout entry point is set when the price penetrates the horizontal resistance level of the pattern. This is the long entry point for the trade. Watch for an increase in buying volume and bullish momentum as the price rises above this resistance line.
3. Set An Ascending Triangle Price Target Order
The third ascending triangle pattern trading step is to set the price target order by measuring the pattern height between the resistance zone and the support zone and adding this number to the long entry price.
What Is the Ascending Triangle Pattern Target?
The ascending triangle pattern target is set by calculating the height of the pattern between the horizontal resistance line and the swing low trough support level and add this number to the buy entry price. A higher ascending triangle height means a better and higher risk/reward ratio as the estimated price target is set higher up.
For example, if the long entry price of this pattern is $20 and the pattern swing low price is $15, the profit target is $25 ($20 + $5).
What Is The Price Target Calculation Formula For an Ascending Triangle?
The ascending triangle pattern price target formula is: Ascending Triangle Price Target = Buy Entry Price + Pattern Height.
4. Place A Stop-Loss Order Below Breakout Candlestick Price Low
The fourth ascending triangle pattern trading step is to place a stop-loss order below the low price of the breakout candlestick.
What Is The Risk Management Of an Ascending Triangle?
Ascending triangle pattern risk management is set by placing a stop-loss order below the breakout candlestick price low. A risk of 1% of trading capital is the risk amount when trading ascending triangles so traders adjust their postion size accordingly. Traders use stop losses to protect against false signals, fakeouts, and protecting their capital.
What Is The Risk Reward Ratio When Trading Ascending Triangles?
The ascending triangle pattern risk reward ratio is $2.50+ reward for every $1 risk.
What Are The Risks When Trading an Ascending Triangle Pattern?
The ascending triangle pattern trading risks are price gap downs causing losses, unexpected negative market news causing bearish price action, and large sellers causing increased selling pressure after the price breakout causing the pattern to fail.
What Are The Common Mistakes When Trading an Ascending Triangle?
The ascending pattern trading mistakes are risking too much per trade, not analyzing the market news prior to trade entry, trading the pattern in illiquid markets with low volume, and placing the stop-loss order at the incorrect price.
5. Conduct Post Trade Analysis
The fifth ascending triangle trading step is to conduct post-trade analysis. Include trading notes, buying and selling prices, trading psychology, and annotated price charts in the post-trade analysis.
What Is an Ascending Triangle Trading Strategy?
An ascending triangle pattern trading strategy is the United States market securities ascending triangle strategy. Scan U.S market securities for bullish price trends of 10%+. Enter a buy trade position when the price breaks out of the pattern on increased buying pressure (green volume bars).
Set a trailing stop loss order along the 20 exponential moving average. When the price candlestick closes below the 20 EMA, close the trading position. Set the position size to 1% of trading capital. Do not apply this trade strategy before or during important market news announcements.
What Type Of Trading Strategies Can Ascending Triangles Be Traded In?
Ascending triangle chart patterns are traded in different types of trading strategies including day trading strategies, swing trading strategies, position trading strategies, automated trading strategies, and short-term scalping strategies.
What Are The Trading Rules Of an Ascending Triangle Pattern?
The ascending triangle pattern trading rules are below.
- Risk a maximum of 1% of trading capital
- Understand the long entry breakout price, exit price profit target, and stop-loss price before entering a buy trade
- Monitor the buyer volume as price breaks out
- Avoid trading the pattern prior to or during important market news events
- Be cautious of false breakouts
- Consider the overall market conditions and broader market trends
What Type Of Traders Trade an Ascending Triangle Pattern?
The ascending flag pattern traders include scalpers, day traders, swing traders, position traders, professional technical analysts, and active investors.
What Type Of Traders Have The Most Success With Trading Ascending Triangles?
The swing trader, position trader, and longer term investor have the most success with trading ascending triangles as the pattern win probability increases on longer timeframes.
What Are Ascending Triangle Pattern Examples?
Ascending triangle chart pattern examples are below.
Ascending Triangle Stock Market Example
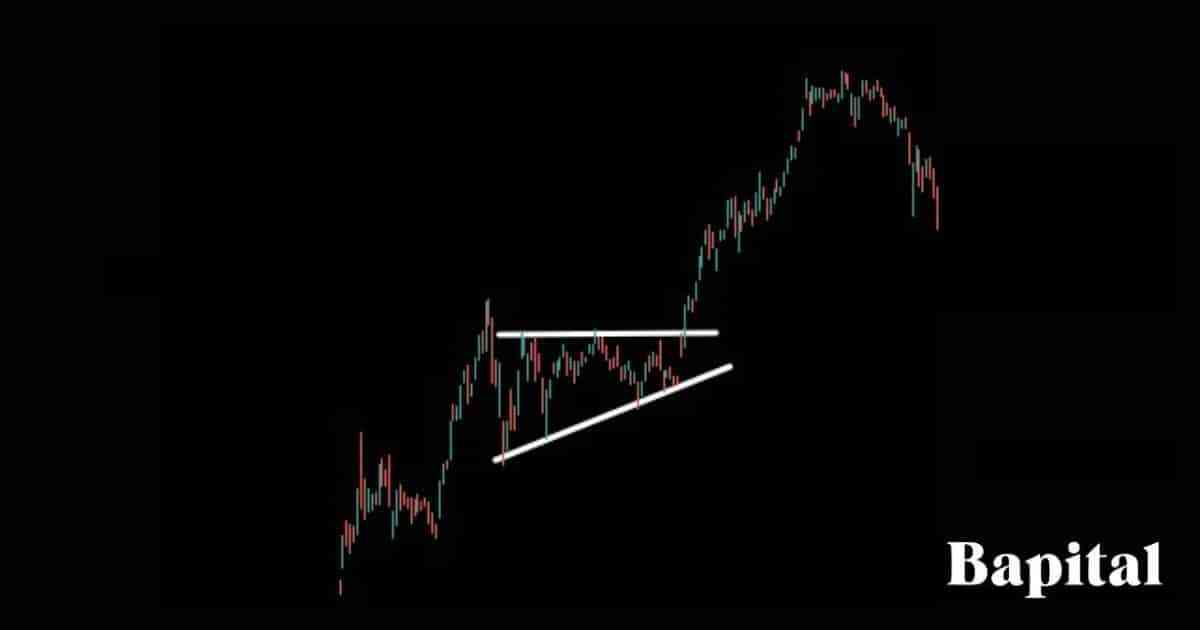
An ascending triangle pattern stock market example is illustrated on the daily Tesla (TLSA) stock chart above. The pattern forms in an already established bullish trend. After a price consolidation period with the narrow choppy price action, Tesla stock price sees a bullish breakout and the stock price moves higher to reach the profit target.
Ascending Triangle Forex Market Example
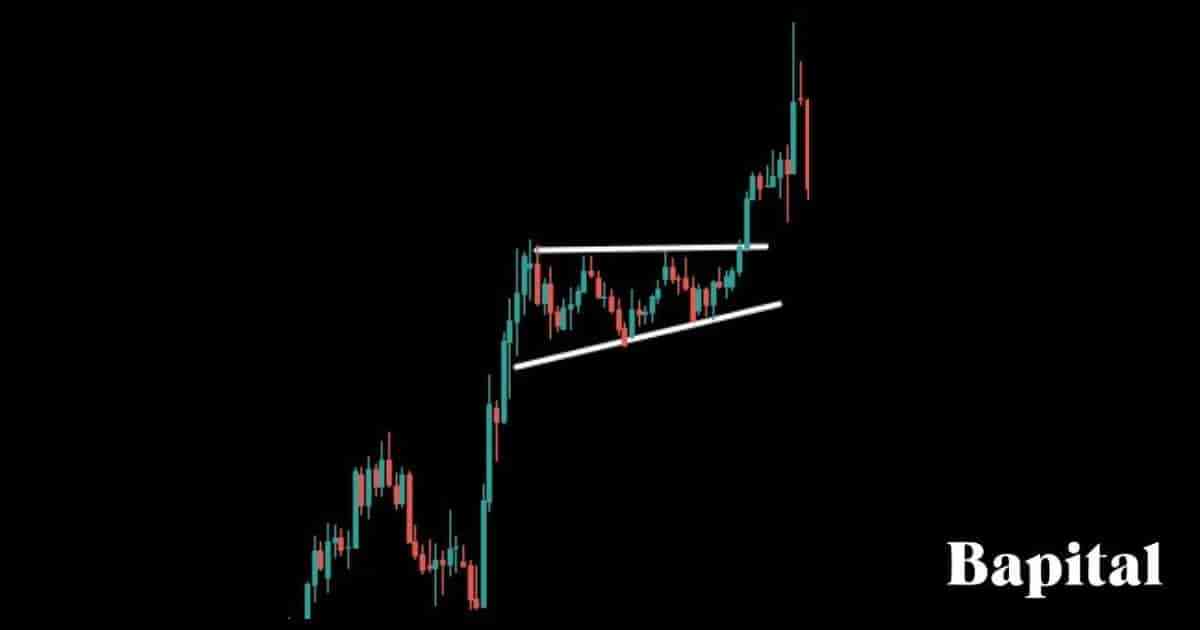
An ascending triangle pattern forex market example is illustrated on the weekly forex chart of GBP/USD currency above. The pattern forms in the middle of a rising trend. After a price consolidation phase with tight volatility, there is a currency price breakout higher over the next few weeks.
Ascending Triangle Short Timeframe Example
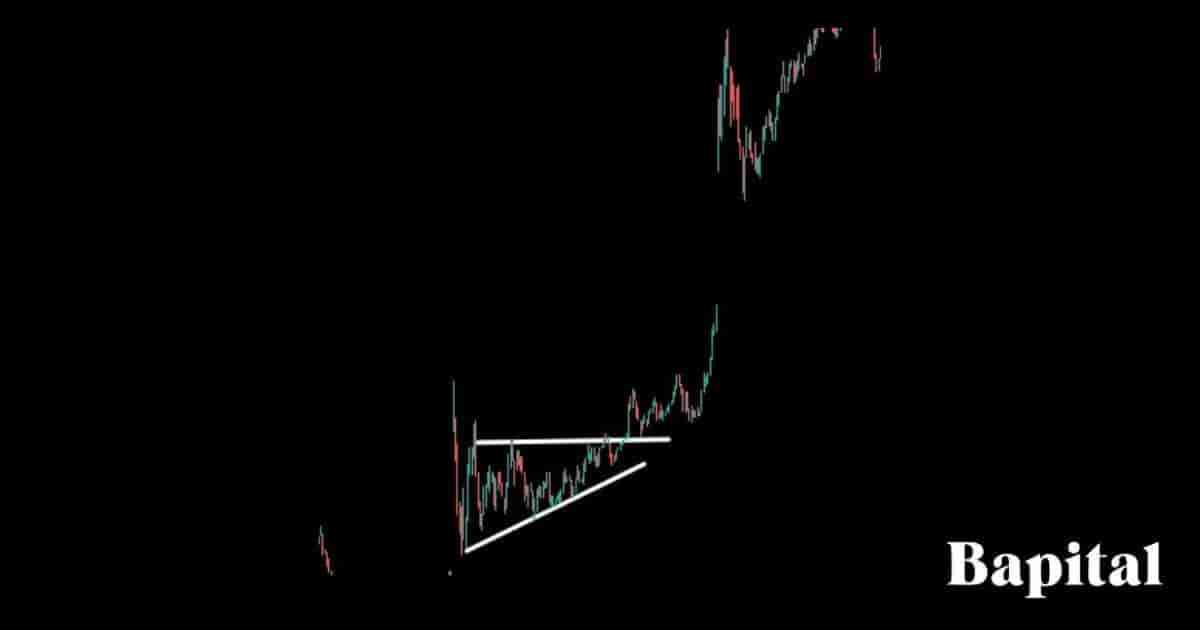
Ascending triangle pattern short timeframe example is visually illustrated on the 3-minute price chart image of Chewy (CHWY) stock above. The pattern forms in a short term uptrend. Price moves up out of the trading range and a gap up on a volume increase leading to higher prices after the eventual breakout in a bullish direction.
Ascending Triangle Long Timeframe Example
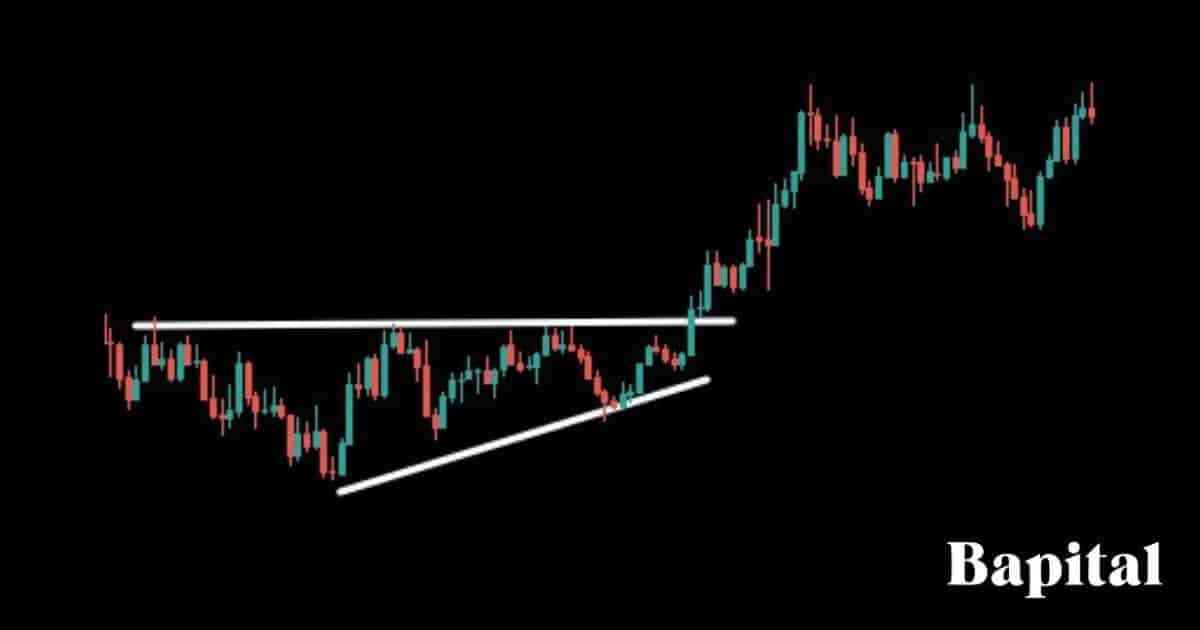
An ascending triangle pattern long timeframe example is shown on the monthly price chart of Gold futures above. The price coiled up within the pattern's price range before breaking out. The market price trends up over the next few months as gold entered a bull run.
What Are The Pros and Cons Of an Ascending Triangle Pattern?
The ascending triangle pattern pros and cons are below.
What Is an Ascending Triangle Pattern Failure?
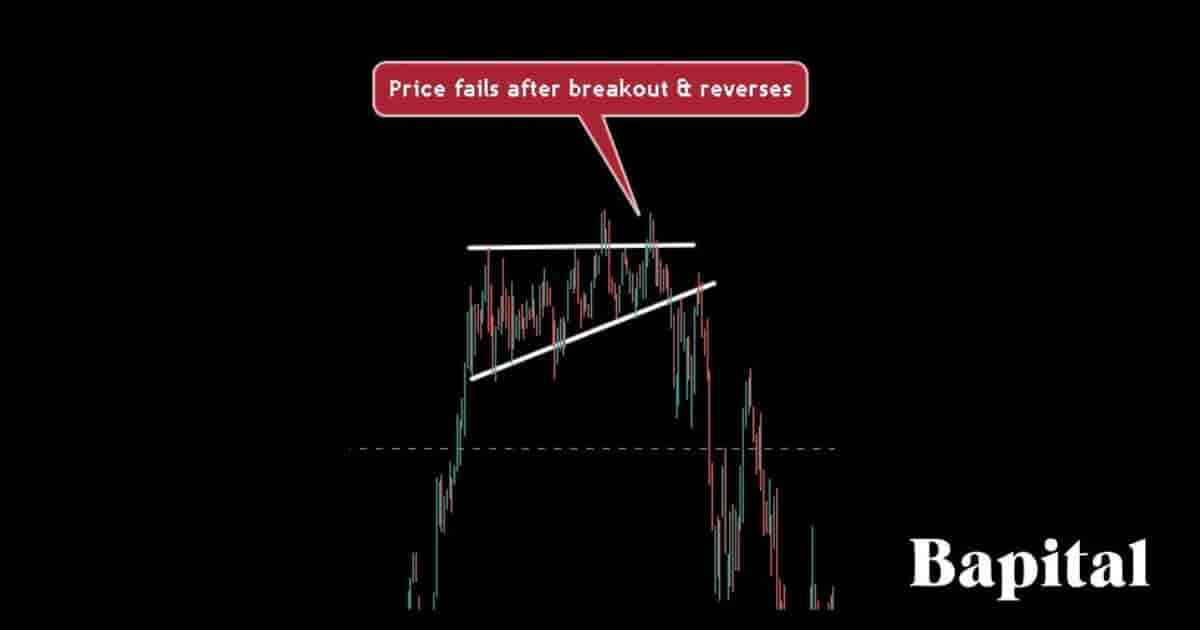
An ascending triangle pattern failure, also known as a "failed ascending triangle", is when an ascending triangle forms but fails. The ascending triangle pattern is invalidated and considered a failed pattern when the market security price rises and breaks out above the horizontal resistance area but quickly results in a major reversal and turns bearish before reaching the pattern target. It is considered a failure once the market price drops from above the horizontal breakout resistance level to below the uptrending support trendline. The ascending triangle pattern failure is a bearish signal.
What Causes an Ascending Triangle Pattern To Fail?
The ascending triangle pattern failure causes are below.
- Economic & Political News Announcements: An ascending triangle failure can be caused by economic or political annoucements creating high price volatility in a market leading to unexpected price movement in a bearish direction
- Lack Of Buying Volume: A failed ascending triangle pattern can be caused by low buying volume on a price breakout from the pattern resistance level as there is no real conviction in the bullish trend
- Poor Market Liquidity: An ascending triangle can fail if the market where the pattern forms is illiquid and lacks trading volume
What Technical Indicators Are Used With Ascending Triangles?
Ascending triangle patterns are used with technical indicators like the exponential moving average indicator, the volume indicator, the MACD, Bollinger Bands, the VWAP, the RSI indicator, and the Fibonacci extensions indicator in technical analysis.
What Is The Most Popular Technical Indicator Used With Ascending Triangles?
The ascending triangle pattern most popular technical indicator used is the volume indicator which acts as a confirmation signal when price breaks out from the pattern.
How Important Is the Ascending Triangle Volume Spike During the Breakout?
An ascending triangle volume spike during the breakout is very important because it is seen as a confirming signal that adds validity to a pattern's success and indicates strong market participation.
What Is The Psychology Behind an Ascending Triangle?
The ascending triangle pattern market psychology is characterized by increasing bullish sentiment. As market prices form higher swing lows within the triangle, it indicates that buyers are becoming more aggressive, willing to enter the market at higher levels.
Simultaneously, the horizontal resistance trendline represents a price point where sellers are aggressive, preventing the price from rising further. This tug-of-war between the support and resistance levels creates a coiling effect, indicating that the buyers are gaining strength, gradually absorbing available supply, and preparing for a potential bullish momentum breakout.
Traders observing this pattern interpret it as a sign of building bullish momentum and anticipate that the price breach of the resistance level will lead to a continued upward move, driven by the prevailing positive bullish sentiment.
What Are The Statistics Of an Ascending Triangle Pattern?
The ascending triangle pattern statistics are displayed on the table below.
How Accurate Are Ascending Triangle Patterns?
Ascending triangle pattern win rate is 47% from our backtesting data of 2,564 of these chart pattern formations.
Is an Ascending Triangle Pattern Reliable?
Yes, an ascending triangle pattern is reliable when the trading rules are followed. Higher timeframe charts are more reliable than shorter term 5-minute and lower timeframe charts.
What Market Conditions Is an Ascending Triangle Most Reliable?
The ascending triangle pattern is msot reliable in bullish trending market conditions with prices moving in an upward direction.
What Market Conditions Is an Ascending Triangle The Least Reliable?
The ascending triangle pattern is least reliable in choppy volatile price action with market prices moving sideways with no clear trend direction.
Is an Ascending Triangle Pattern Profitable?
Yes, an ascending triangle pattern is profitable as the average success rate is 47% and the average return to risk ratio is 2.5 to 1. This means for every 100 trades, a trader wins 47 trades making 2.5 units (117.5 units total) and loses 53 trades losing 1 unit (53 units total). Therefore, over 100 trades, a trader should hypothetically net 64.5 units (117.5 units - 53 units). Be aware that past performance is not indicative of future results.
What Are Alternatives To An Ascending Triangle?
The ascending triangle pattern alternatives are listed below.
- Cup and handle chart pattern
- Bullish flags
- Bullish pennant chart pattern
- Gap patterns
- Symmetrical triangle
- Descending triangle
What's The Difference Between An Ascending Triangle vs Symmetrical Triangle Pattern?
The ascending triangle pattern differences with a symmetrical triangle pattern are its shape and what it signals. An ascending triangle pattern is shaped with a flat horizontal resistance level and a rising support trendline whereas the symmetrical triangle is shaped with an upward sloping support trendline and a downward sloping resistance trendline which are converging trendlines.
An ascending triangle pattern is a bullish signal that predicts an upside breakout in the market whereas a symmetrical triangle can be either a bullish or bearish signal depending on the breakout direction from the pattern.
What's The Difference Between an Ascending Triangle vs Rising Wedge?
The ascending triangle pattern differences with a rising wedge is that an ascending triangle is mainly considered a bullish continuation chart pattern formation while the rising wedge is a bearish reversal chart pattern. Secondly, the ascending triangle has a horizontal resistance level and upward sloping support line while a rising wedge has two converging upward sloping support and resistance trendlines.
What Are The Key Facts Of an Ascending Triangle?
The ascending triangle pattern key facts are below.
