What Is a Bear Flag Pattern?
A bear flag pattern is a bearish pattern that signals a continuation of an existing downtrend, indicating further price decreases. Bear flags are a bearish continuation pattern, forming in the middle of an already established bearish trend. A price breakdown from the pattern's support level typically results in a sharp price downtrend. A bear flag formation gets its name as it resembles an upside-down flag and flagpole shape. A bear flag is also known as a "bearish flag" and it is a bearish signal.
Bear Flag Pattern Components
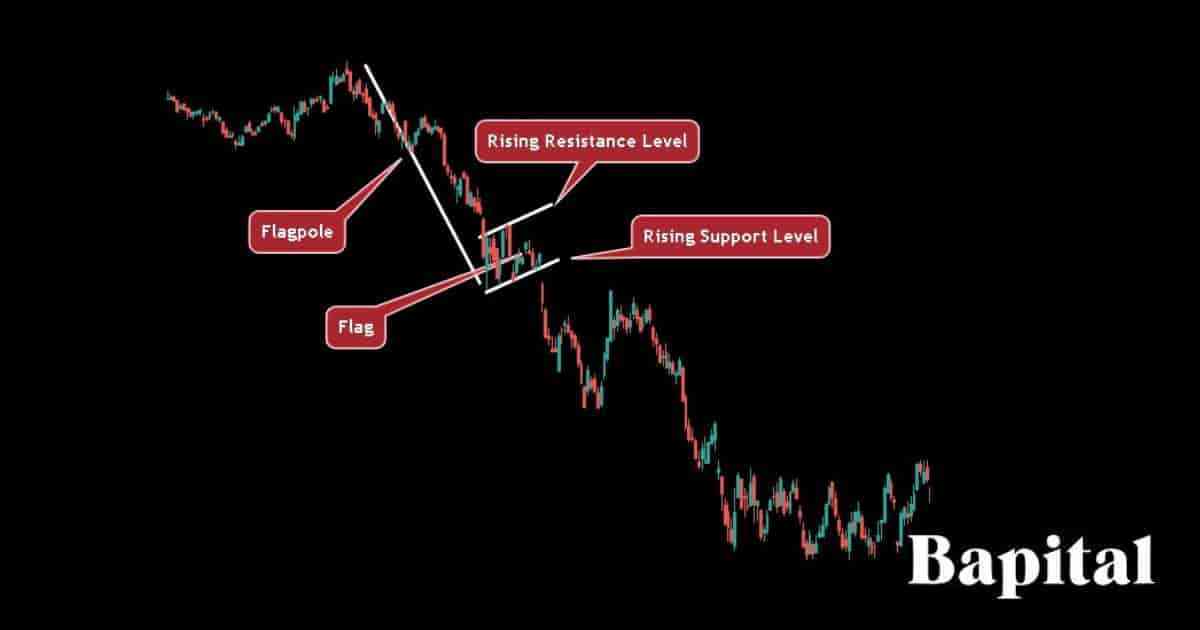
The bear flag pattern components are below.
- Declining Flagpole: The bear flag flagpole component is a downtrending line that illustrates the strong downward directional move in asset prices
- Flag: The bear flag "flag" component is a rectangular or sloping-shaped consolidation area in which the price moves in a narrow tight range
- Rising Support Level: This is the bear flag rising support level that connects the swing low prices together
- Rising Resistance Level: This is the bear flag resistance level that connects the swing high prices together. It is a parallel rising trendline to the upward-sloping support trendline
- Breakout: This is the breakout component that sees prices break down below the pattern support area, confirming the pattern completion
Understanding these 5 components helps a trader to identify the bearish flag pattern in all global markets.
Bear Flag Pattern Causes
A bear flag pattern is caused by a sharp downward price movement, known as the flagpole, followed by a brief price consolidation or narrow sideways movement with low volatility, forming a rectangular-shaped flag. This consolidation phase represents a pause or a period of profit-taking by traders who participated in the initial downward movement.
Pattern confirmation occurs when the price breaks below the lower flag boundary, signaling a potential downtrend continuation. Traders often use the bear flag as a technical analysis tool to anticipate further price declines and make informed short trading decisions.
How To Trade Bear Flags
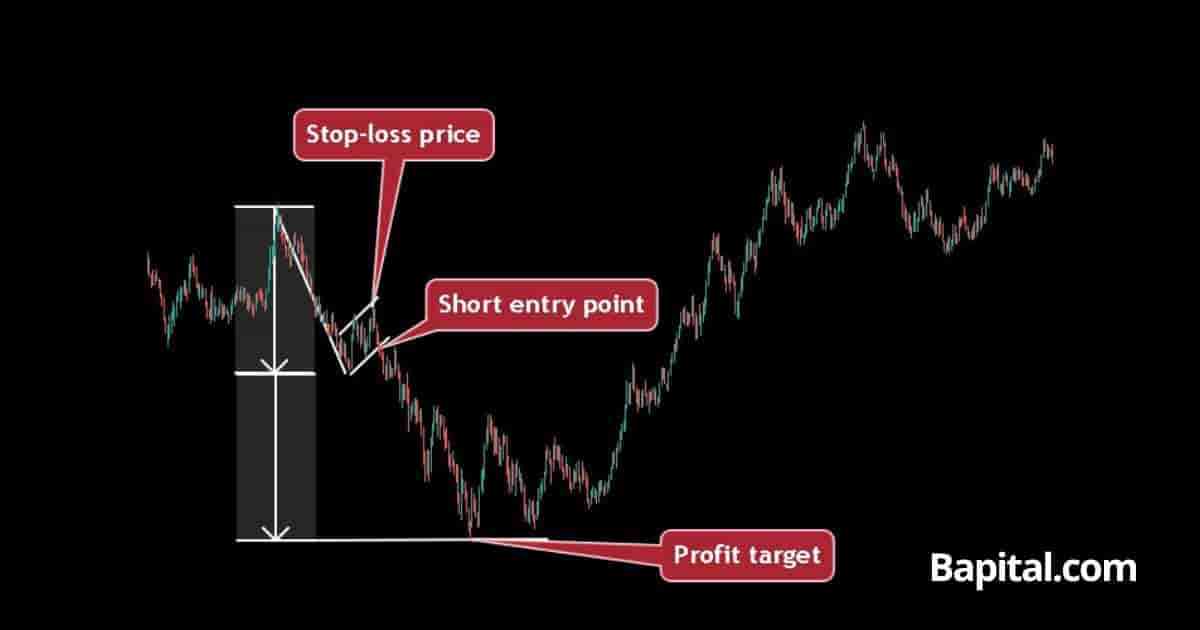
The bear flag trading steps are below.
- Enter short trade when price breaks below the pattern's support area
- Place stop-loss order above the pattern's resistance swing high price
- Set price target by calculating the flagpole height and subtracting this calculation from the short entry point
- Ensure the reward/risk ratio is 3 to 1 at a minimum, i.e. reward $3+ for every $1 risked
Bear Flag Entry Point
A bear flag pattern entry price is set when the price penetrates the rising support trendline of the pattern. The is the short entry point for the short trade. Watch for increasing selling volume and bearish momentum as the price decreases below the support line.
Bear Flag Price Target
A bear flag pattern price target is set by measuring the flagpole height and subtracting this measurement from the short breakout price.
For example, if the shorting entry price is $100 and the height of the flagpole is $20, the profit target is $80 ($100 - $20).
Bear Flag Price Target Calculation Formula
The bear flag price target formula is: Bear Flag Price Target = Short Entry Price - Flagpole Height.
Bear Flag Risk Management
A bear flag pattern risk management is set by placing a stop-loss order above the swing high declining resistance level price of the pattern. Traders use 1% trading capital risk when trading bear flags. A stop-loss orders helps protect against bullish price reversals, price fakeouts, and high volatility markets.
A bear flag pattern risk/reward ratio is 1:3 (risk $1 to reward $3+).
Bear Flag Trading Strategy
A bear flag pattern trading strategy is to scan the daily financial market charts for bearish price trends of -10% or more. Wait for a bear flag to form. Enter a shorting position when the market price decreases below the support level of the pattern on increased selling pressure (red bars).
Place a 10 exponential moving average overlay on the chart. Set a trailing stop loss order along the 10EMA. When the security price candlestick closes above the 10EMA, close the trading position. Set the trade position size to equal a maximum of 1% position size. Do not trade this strategy during or prior to big market news events.
This bear flag trading strategy can be adjusted in timeframe to suit day trading strategies, swing trading strategies, position trading strategies, and scalping strategies.
Bear Flag Trading Rules
The bear flag pattern trading rules are listed below.
- Risk 1% of trading capital
- Enter short trade when price breaks support only
- Know the stop loss price, exit price, and entry price prior to trading
- Monitor for increasing seller volume after price breakdown
- Calculate the position size prior to trade entry
- Avoid trading before or during important political or economic news announcements
Bear Flag Pattern Examples
Bear flag candlestick pattern examples are illustrated on market charts below.
Bear Flag Stock Example
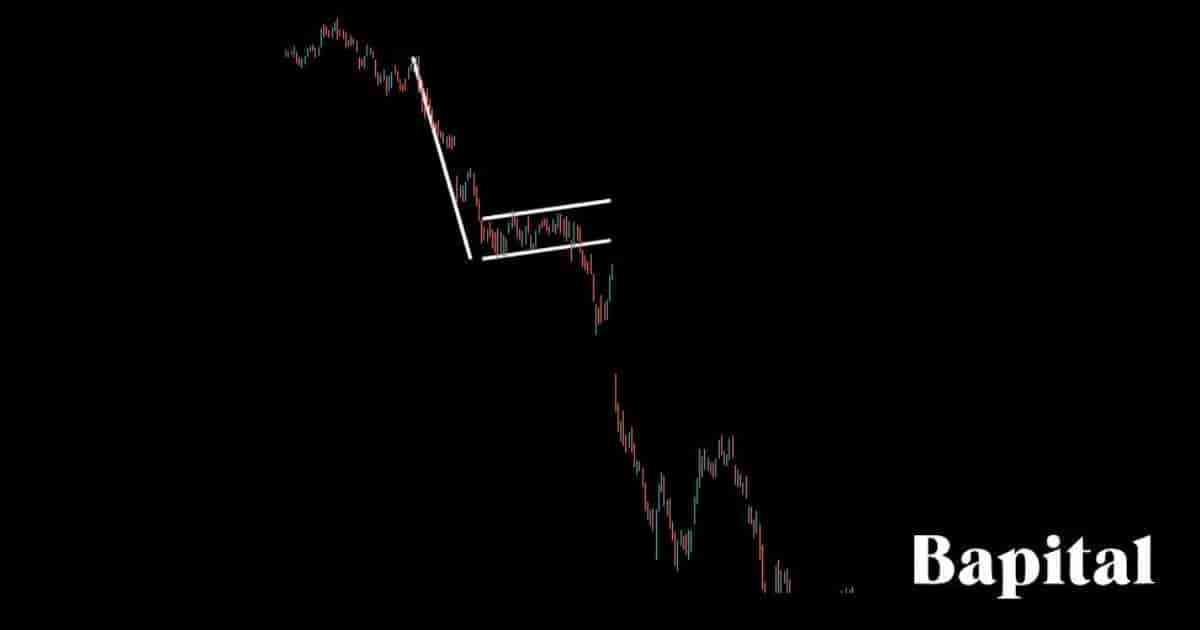
A bear flag pattern stock example is illustrated on the daily price chart of Affirm Holdings (AFRM) above. The stock price decreases in an initial bearish trend before a price bounce and sideways range forms. A price breakdown occurs from the pattern consolidation leading to downtrending price movement and a gap down over the next two months.
Bear Flag Forex Example
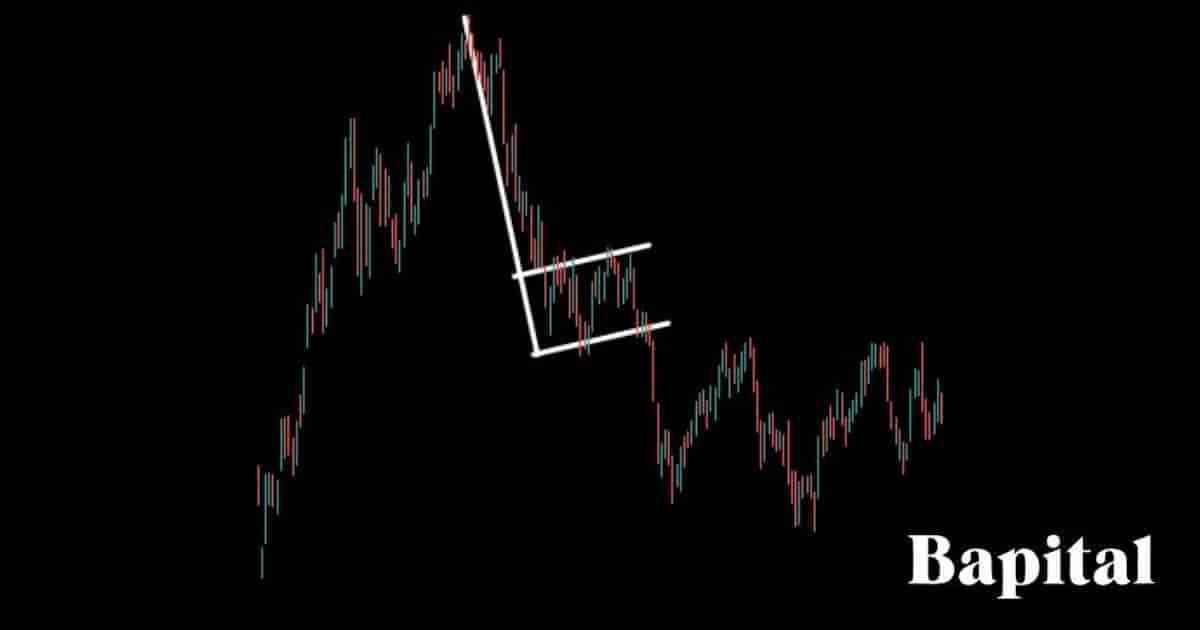
A bear flag pattern forex market example is shown on the hourly market chart of EUR/USD above. The forex price is falling in a bearish movement before consolidating at lower prices within a price range. The currency price breaks lower below the support line and continues in a bearish direction until it reaches the trade profit level.
Bear Flag Short Timeframe Example
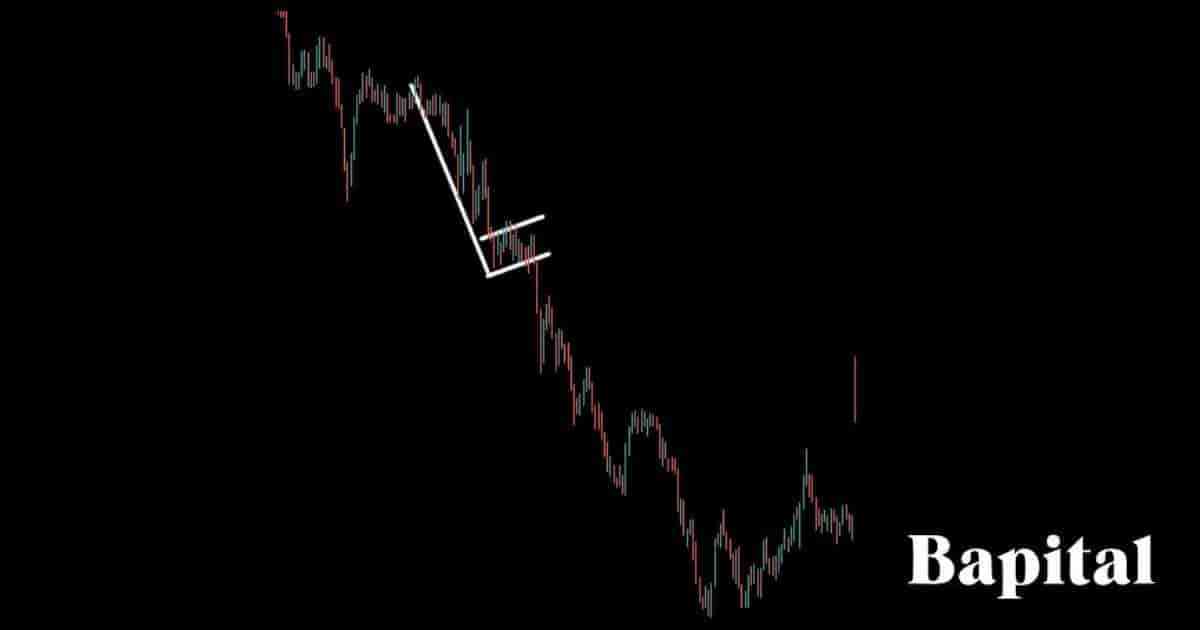
A bear flag pattern short timeframe example is displayed on the 5-minute price chart of Chewy stock (CHWY) above. Chewy price moves in an initial bearish direction before a samll consolidation phase. The security price breaks lower after the consolidation period and continues to reach the target level.
Bear Flag Long Timeframe Example
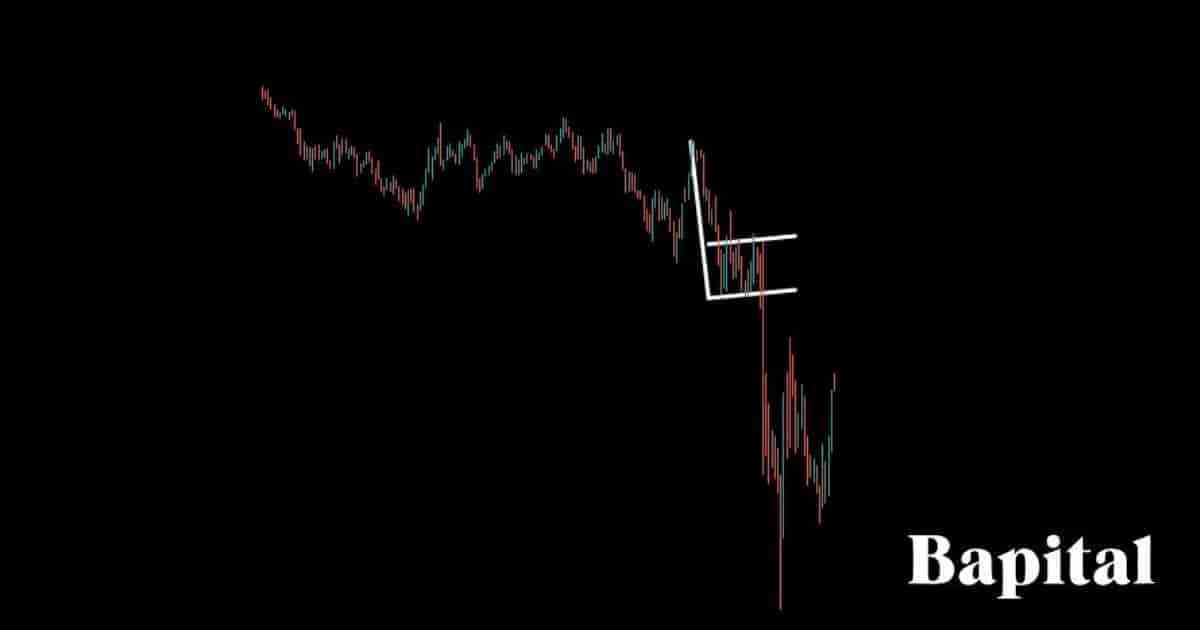
A bear flag pattern long timeframe example is shown on the weekly stock chart of Ford stock (F) above. Ford stock price falls initially forming the flag pole before a small bounce and consolidation occurs creating the flag component. Eventually, the price breaks sharply lower to reach the target profit level in two weeks.
Bear Flag Pattern Failure
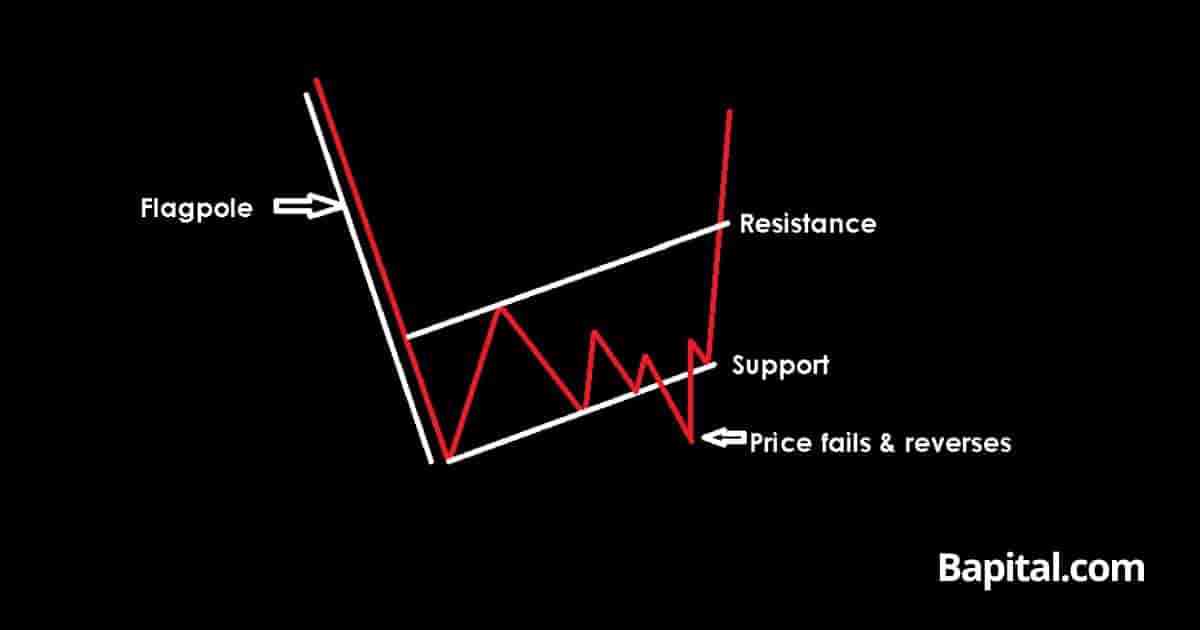
A bear flag pattern failure, also known as a "failed bearish flag", is when a bear flag forms but fails to continue lower in price. The bear flag pattern is invalidated and fails when the market price drops below the breakdown entry price in a bearish movement but reverses from below the support point to trend higher above the pattern's resistance point in a bullish direction. A failed bear flag is a bullish signal.
Bear Flag Pattern Failure Causes
The bear flag pattern failure causes are below.
- Lack Of Selling Volume: Low selling volume when the market security price penetrates below the bear flag support area can cause a bear flag pattern to fail. If there are few sellers after the market breaks down, this can be an indication that traders are not confident in the market trending lower and instead believe there will be a failure to continue lower after the price breakdown
- Positive Market News: Positive financial market news can cause a price reversal from a bearish to bullish uptrend and result in a failed bear flag
- Major Support Level: A major support level below the bear flag pattern can mean the market will struggle to go lower. This can mean the bear flag will fail at the major support line and reverse in a bullish direction to higher prices
Bear Flag Pattern Benefits
The bear flag pattern benefits are listed below.
- Helps Identify Potential Bearish Move: A bear flag pattern can help a trader find potentially large bearish price moves in the markets
- Great Risk-Reward Ratio: A bear flag can offer a great risk-reward ratio on short trades with a very small risk for potentially larger profits, typically risk $1 to make $3+
- Great Multiple Market Application: A bear flag can form in any market and is not restricted to just a few
- Useful Multiple Timeframe Application: Bear flags can be found on any timeframe and are not restricted to just one timeframe which means scalpers, day traders, and swing traders utilize this pattern
Bear Flag Pattern Limitations
The bear flag pattern limitations are listed below.
- False Breakdown: A bear flag can trigger a short trade and the price may not continue to move lower and instead move sideways in a volatile manner creating a false breakdown signal
- Subjective Interpretation: Identifying bear flag patterns involves a subjective element, and different traders may interpret them differently. This subjectivity can lead to variations in trading decisions
- Market Noise Issues: In volatile markets, bear flag patterns may be overshadowed by market noise, making it challenging to discern genuine sell signals from random price fluctuations
Bear Flag Pattern Psychology
The psychology of a bear flag pattern is rooted in market participants' behavior with a strong surge in selling activity creating the flagpole, reflecting pessimism and a lack of confidence in the asset.
As prices reach lower levels, traders decide to take profits, resulting in a consolidation or price bounce. This profit-taking phase introduces an element of caution and a desire to secure gains among short sellers. However, the overall sentiment remains negative, with traders viewing the consolidation as a temporary price pause rather than a shift in trend.
The flag formation represents a balance between profit-taking and general bearishness. During this period, traders assess the weakness of the underlying trend, preparing for a potential continuation of the downward movement. The psychology underlying the flag component is a balance between profit taking and the expectation of further price depreciation.
Bear Flag Pattern Frequently Asked Questions
Below are frequently asked questions about the bear flag chart pattern.
Are Bear Flags Used In Technical Analysis or Fundamental Analysis?
Bear flags are used in technical analysis and not fundamental analysis.
What Does a Bear Flag Tell You?
A bear flag pattern suggest a bearish price movement in the market is imminent if the asset price declines below the support trendline. A bear flag is used a tool to predict lower market prices.
What Is The Opposite Of A Bear Flag Pattern?
The opposite of a bear flag pattern is a bull flag pattern which signals a bullish continuation price movement.
How Accurate Are Bear Flag Patterns?
A bear flag pattern win rate is 47% from our backtesting data of 3,093 of these chart pattern formations.
How Often Do Bear Flags Occur?
A bear flag pattern occurs 5 - 7 times per year on a daily timeframe chart in bearish market environments.
What Type Of Price Charts Do Bear Flags Form On?
Bear flags form on candlesticks, line charts, point and figure charts, and OHLC charts.
What Timeframe Price Charts Do Bear Flag Patterns Form On?
The bear flag pattern forms on timeframes from short timeframe 1-second charts up to higher timeframe monthly charts and yearly price charts.
How Long Does a Bear Flag Take To Form?
Bear flags formation time is 45+ minutes on a 1-minute price chart to 45+ years on a yearly price chart. To calculate the bear flag formation time, multiple the chart timeframe used by 45. For example, a 15-minute timeframe price chart means a bear flag will take a minimum of 11.25 hours (15 minutes x 45) to form.
What Technical Analysis Indicators Are Used With Bear Flags?
Bear flags are used with technical indicators like the volume indicator, moving average overlay, volume weighted average price indicator (VWAP), Keltner channels, and Bollinger bands. .
How Do Traders Find Bearish Flags?
Bear flag patterns are found by using tools like a bear flag charting screener, browsing price charts manually, and checking the online social feeds of prominent traders and expert chartered market technicians (CMT).
What Type Of Traders Use Bear Flag Patterns?
A bear flag pattern is used by scalpers, day traders, swing traders, long term traders, professional technical analysts, and active investors.
Is a Bear Flag Pattern a Contination or Reversal Pattern?
A bear flag pattern is a bearish continuation pattern that indicates a downward price trend continuation.
What Books Can I Learn About Bear Flags?
Bear flag pattern books to learn from are Technical Analysis Of The Financial Markets by John Murphy and Encyclopedia of Chart Patterns by Thomas Bulkowski.
What Are Similar Bearish Patterns Like The Bear Flag?
Bear flag patterns are similar to bearish patterns like the bearish pennant pattern and the bearish descending triangle pattern.
What Are Bear Flag Pattern Alternatives?
Bear flag pattern alternatives are listed below.
- Bearish pennant pattern
- Head and shoulders chart pattern
- Descending triangle pattern
- Symmetrical triangle price pattern
- Triple tops
- Double tops
- Diamond tops
- Price channels
