What Is A Bump And Run Reversal Chart Pattern?
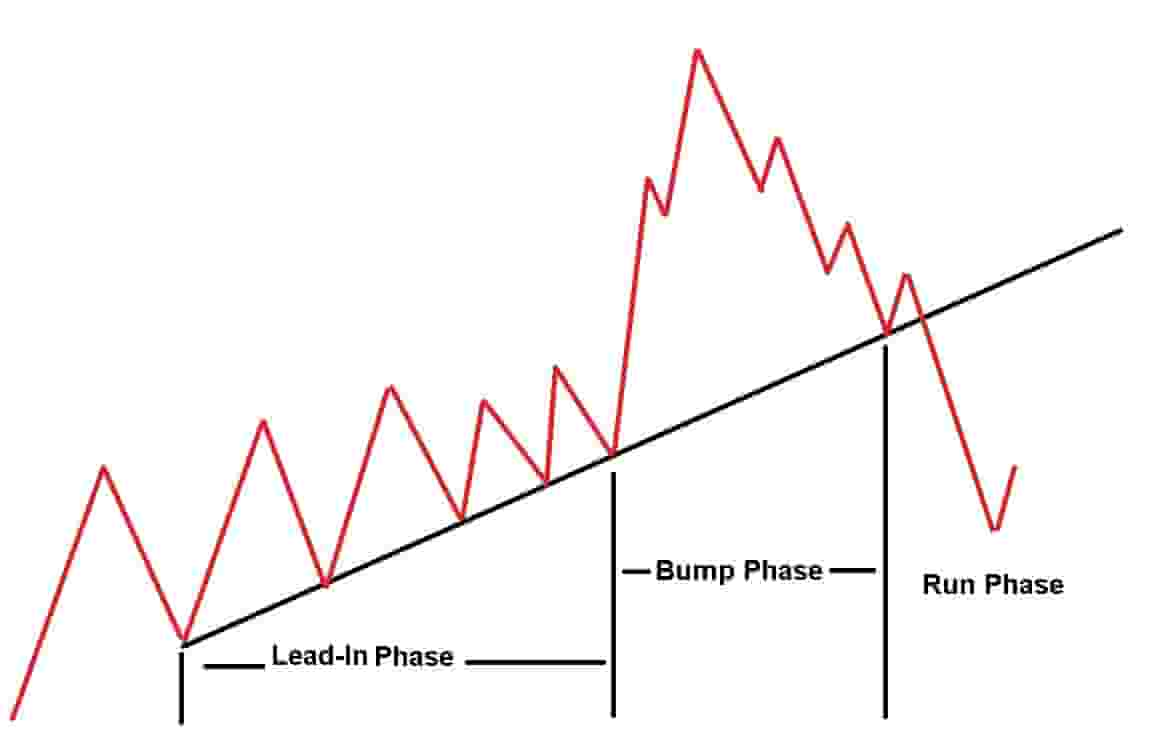
In technical analysis, a bump and run reversal pattern (BARR), also known as a "bump and run reversal top", is a bearish reversal chart pattern that forms when the price of a financial market is in an orderly bullish trend and the price suddenly and quickly advances higher in a frenzied manner with higher speculation before the price reverses and declines sharply.
The bump and run reversal pattern signals that the price of a market will reverse from bullish price action to bearish price action.
The bump and run reversal pattern was created by Thomas Bulkowski. He first introduced the pattern to the world in the magazine, "Technical Analysis of Stocks & Commodities", in June 1997 (1).
He also explained the bump and run reversal pattern in detail in his book, Encyclopedia of Chart Patterns (2).
Bump And Run Reversal Pattern Phases

In order to identify the bump and run reversal pattern on a price chart, there will need to be three phases visible on the price chart.
The three phases of the bump and run reversal pattern are:
- Lead-In Phase: This is the initial phase of the pattern. The price of a market should be trending higher in an orderly manner at an angle of between 30 degrees but no higher than 45 degrees. The lead-in phase should last a duration of at least 1 month.
- Bump Phase: The bump phase is when the price of a market starts to speed up and trend even higher at a rapid pace and at a steeper angle, typically between 45 degrees and 60 degrees. The price then begins to roll over and reverse back to the lead-in phase trend line. The bump phase usually occurs on higher volume.
- Run Phase: The run phase is when the price of a market starts to break the rising trendline support level. Only when the price breaks the trendline support level is the pattern complete. The bearish trend after the break of the support level is the run phase.
Bump And Run Reversal Chart Pattern Examples
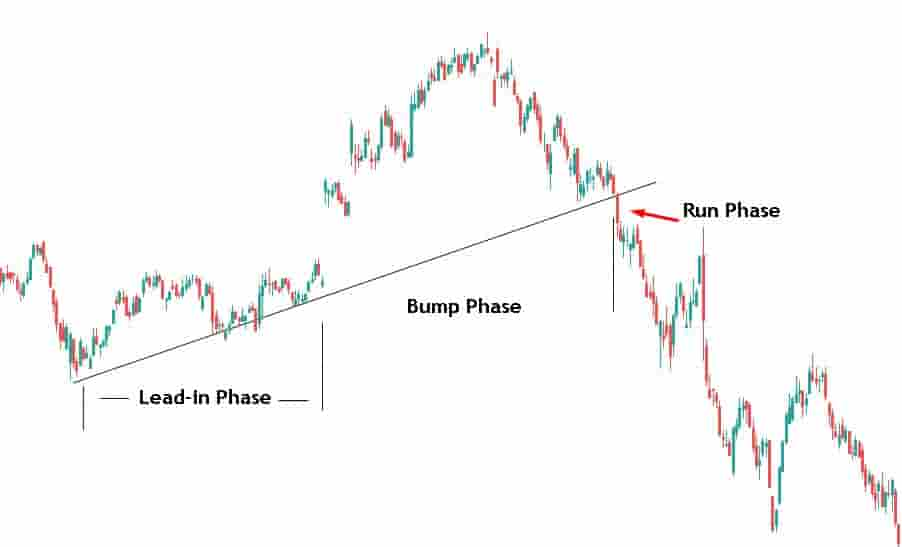
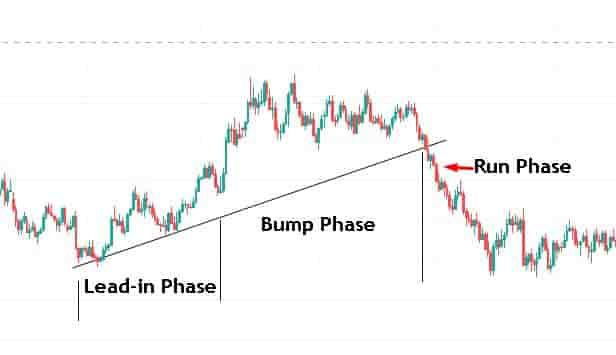
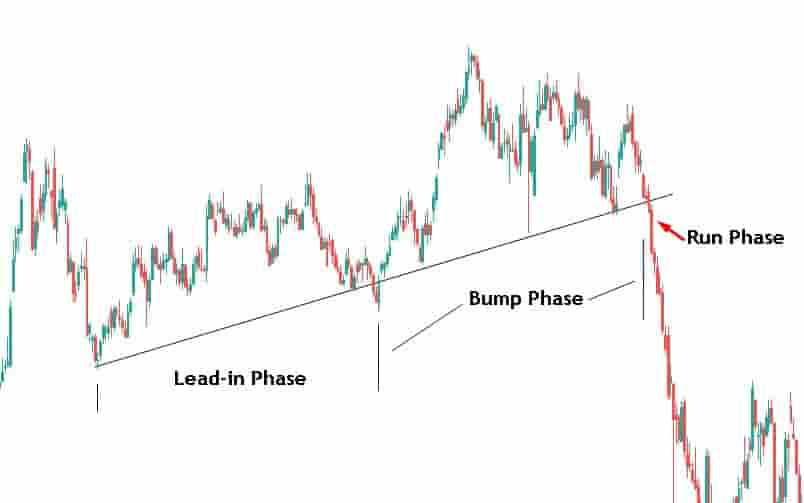
Below are visual examples of the bump and run reversal chart pattern.
Example Of A Bump And Run Reversal Pattern In Stocks

On the above price chart of Affirm holdings stock, a bump and run reversal pattern formed.
The lead-in phase last 3 months with the price making an orderly move higher in prices.
Then the bump phase began with a gap up in the price on earnings and a rapid increase in the bullish trend.
The price of Affirm stock then reversed and moved back down to the rising support level trendline of the lead-in phase.
Once the price breaks down below the rising trendline support level, the run phase begins where the bearish trend is confirmed and the price declines much lower.
Example Of A Bump And Run Reversal Pattern In Forex Market

On the price chart of EUR/USD currency pair, a bump and run reversal pattern forms.
The lead-in-phase lasts 3 months with orderly bullish price action. The price of the currency pair starts to rapidly increase in price when it enters the bump phase.
The price moves back down to the rising uptrend support level before it breaks down below it and enters into the run phase of the pattern. The prices trend much lower during the run phase.
Example Of A Bump And Run Reversal Pattern In The Commodity Market

On the price chart of Soybean futures above, a bump and run reversal pattern forms.
The lead-in phase lasts four months where the price of Soybean futures moves in an orderly bullish manner higher.
The price of the market then enters into the bump phase where there is a fast and aggressive move higher in the price of Soybeans before it tappers off and moves back to the rising support level outlined in the lead-in phase.
Once the price of the market breaks down below the uptrend support level, the market enters into the run phase where the market declines much lower over the coming months.
How To Find Bump And Run Reversal Chart Patterns
The methods for finding a bump and run reversal pattern in the market are:
- Use a percentage movers scanner: Use a percentage gainer scanner to scan for trading instruments that are up a certain percentage. Then browse through the charts to find markets in the bump phase.
- Manually browse the price charts: Manually scroll through the price charts of markets to find the bump and run reversal pattern forming in real-time.
Bump And Run Reversal Chart Pattern Benefits
The benefits of the bump and run reversal pattern are:
- It provides logic and understanding of the price action: A bump and run reversal pattern can provide a trader with an understanding of what is going on in the market
- It can offer shorting opportunities in the market: A bump and run reversal pattern can offer shorting opportunities and signals for traders.
- It can offer a low-risk entry for joining a bearish trend: A bump and run reversal pattern can offer a low-risk entry point with the potential to capture a large bearish move in the price of a market.
- It can work in any financial market: The bump and run reversal pattern can work in any market where it forms and is not limited to just one or a few markets.
Bump And Run Reversal Chart Pattern Limitations
The limitations of the bump and run reversal pattern are:
- The pattern can fail: Like any pattern, the bump and run reversal can and will fail from time to time.
- They can be hard to spot: The bump and run reversal can be a tough pattern to spot in the market. The price action is sometimes unclear which makes it harder to spot.
Frequently Asked Questions About The Bump And Run Reversal Chart Pattern
Below are frequently asked questions about the bump and run reversal chart pattern.
Is A Bump And Run Reversal Pattern Bullish Or Bearish?
A bump and run reversal pattern is a bearish reversal chart pattern. It signals that the price will reverse from a bullish trend to a bearish trend.
What Does A Bump And Run Reversal Pattern Tell You?
A bump and run reversal pattern tells a trader that the market was in an orderly bullish trend with a steady price increase before there was a sharp rise and exhaustion in the buying pressure before the price reverses and declines and a new bearish trend forms.
Does The Bump And Run Reversal Pattern Work On Any Timeframe Price Chart?
The bump and run pattern reversal can work on any timeframe as long as the lead-in phase is longer than 1-month duration as instructed by the creator of the pattern, Thomas Bulkowski.
Ideally, the best timeframes to use for finding the bump and run reversal pattern are the daily and weekly timeframe price charts.
