What Is a Descending Triangle?
A descending triangle pattern is a pattern that signals the market price will decline downward in a bearish direction after a price breakdown from the pattern's support level. Descending triangles form in the intermediate (middle) part of a bearish price trend and these patterns indicate a continuation of a already-established bearish trend. A descending triangle pattern is also referred to as a "right-angle triangle".
Descending Triangle Pattern Components
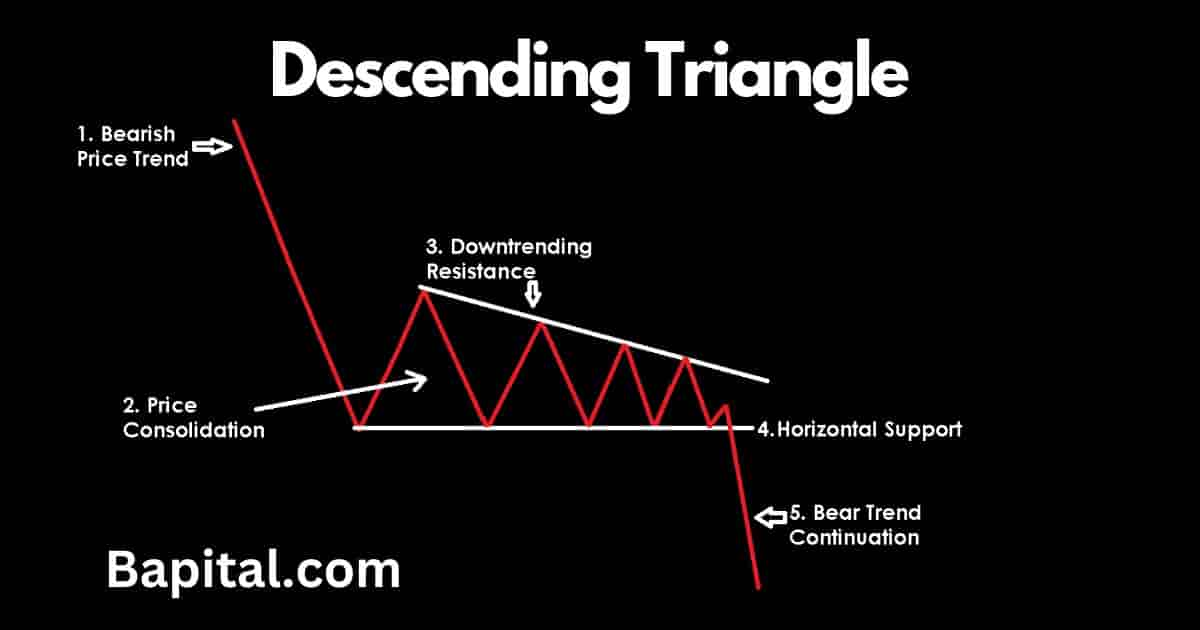
The descending triangle pattern components are below.
- Bearish Downtrend: The descending triangle's first component is a bearish price trend. This is identified by steady price declines in a downward bearish trend
- Price Consolidation: The descending triangle's second comnponent is a price consolidation phases where the price moves within a range marked by lower swing highs and horizontal swing lows
- Upper Downtrending Resistance Level: The third component is a downtrending resistance level that connects the lower swing price highs together
- Lower Horizontal Support Level: The fourth component is a horizontal support level that connects the swing price lows together
- Price Breakout: The fifth component is a price breakout to the downside from the horizontal support area of the pattern. Traders enter short trades at this point
Understanding these 5 components helps traders identify the descending triangle in all global markets.
Descending Triangle Causes
The descending triangle pattern formation process starts firstly with a bearish downtrend which is caused by a series of lower highs and lower lows and declining prices with increased selling pressure.
Secondly in the descending triangle pattern formation process is the sideways price consolidation phase which is caused when both buyers and sellers are buying and selling with no clear bearish or bullish momentum. Price tends to move within a narrow trading range and the descending pattern forms during this phase.
Thirdly in the descending triangle pattern formation process is the bearish price breakdown which is caused by large selling pressure and prices dropping below the support point, marked by a series of lower price highs and lower price lows.
How To Draw Descending Triangle Pattern
Descending triangle pattern drawing involves firstly plotting a downward sloping resistance trendline on the price chart from left to right that connects the lower swing high prices together. Mark the the pattern's first swing high point and connect this point directly to the lower swing high points with a trendline.
Secondly, draw a horizontal support trendline from left to right that connects the swing low prices of the pattern together. Start with the lowest swing low point on the pattern's left-hand side and join it with the other swing low points together horizontally.
When drawing a descending triangle, a minimum of two swing high peaks for the resistance line and two swing low troughs for the support line are needed to successfully complete the drawing.
How To Trade Descending Triangle Pattern
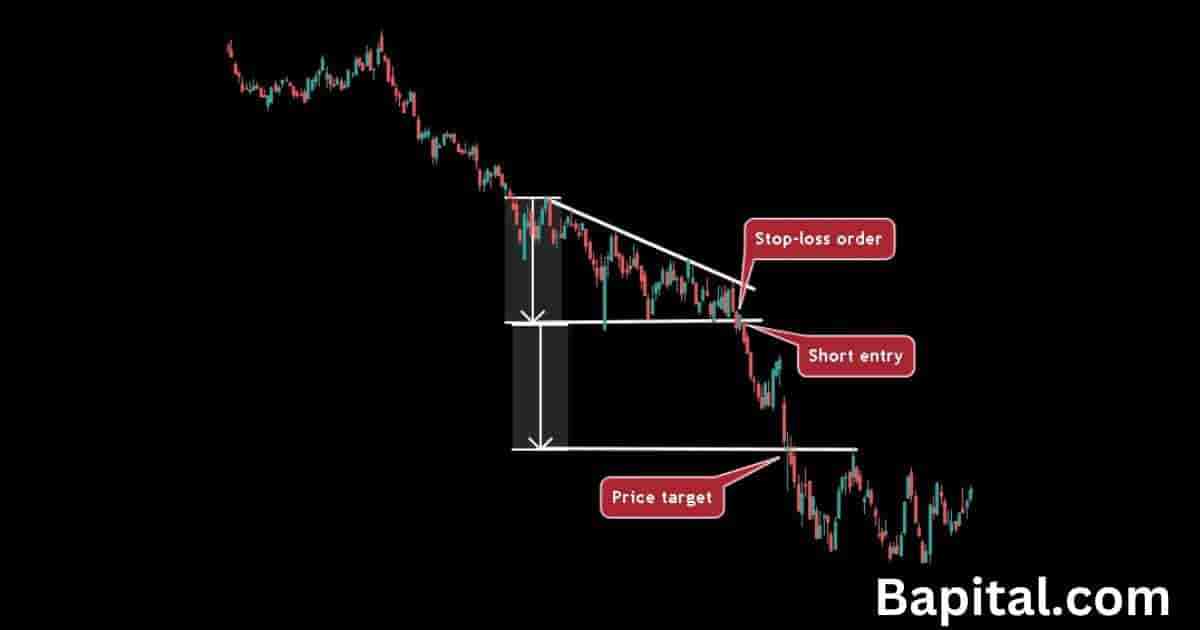
The descending triangle pattern trading steps are below.
- Enter a short trade when the price breaks below the pattern support level
- Watch for increasing selling volume after price breakdown
- Set trade profit target by measuring the pattern height and subtracting that number from the short entry point
- Place a stop-loss order above the breakdown candlestick price high
- Set trade position size to risk 1% of trading capital
Descending Triangle Entry Point
A descending triangle pattern entry point is set when the price penetrates below the horizontal support line of the pattern. This breakdown level is the short trade entry point. Watch for an increase in selling volume and bearish momentum as the price declines below the support area.
Descending Triangle Price Target
The descending triangle price target is set by measuring the height of the pattern between the swing low support line and the swing high resistance price and subtracting this calculation from the short entry level.
For example, if the short entry price of this pattern is $55 and the pattern's height is $10, the profit level is $45 for the short trade.
Descending Triangle Price Target Formula
The descending triangle price target calculation formula is: Descending Triangle Price Target = Short Entry Price - Pattern Height.
Descending Triangle Risk Management
Descending triangle pattern risk management is set by placing a stop-loss order above the breakdown candlestick price high. Risk 1% of capital. Traders use stop losses to protect against price fakeouts, false signals, and trading capital preservation.
A descending triangle pattern risk reward ratio is 3:1 meaning a reward of $3+ for every $1 risked.
How To Reduce Descending Triangle Trading Risk
Descending triangle pattern risk is reduced by trading smaller size, avoiding illiquid markets, and avoiding extremely volatile markets with large whipsawing price movements.
Descending Triangle Trading Strategy
A descending triangle pattern trading strategy is to scan the U.S. equities market for stocks trending -10% or lower. Wait for a price consolidation phase and the pattern to form. Put a 15 simple moving average overlay on the market chart. Enter a short trade when the market price drops below the pattern support line on increased selling volume (red bars).
Set a trailing stop loss order along the 15 simple moving average. When the candlestick price closes above the 15SMA, close the trading position. Set the position size to reflect 1% of trading/investing capital. Do not apply the trading strategy during high volatility market environments.
Descending Triangle Trading Rules
The descending triangle pattern trading rules are below.
- Risk 1% of trading capital total
- Avoid trading prior to or during important company, economic and political news announcements
- Calculate the trade entry price, trade exit price, and the trade stop loss price prior to trade entry
- Adjust position sizing to reflect a 1% risk level
- Avoid trading this pattern in illiquid markets
Descending Triangle Pattern Examples
Below are real-life visual examples of descending triangle chart patterns in different markets.
Descending Triangle Stock Market Example
A descending triangle pattern stock market example is illustrated on the daily stock chart of Groupon (GRPN) stock above. Groupon stock price originally trends lower in a downward direction before the price stalls and bounces within a narrow range, evening forming the descendign triangle. Groupon price moves lower below the support trendline before a sharp price drop to the exit price of the trade.
Descending Triangle Forex Market Example
A descending triangle pattern forex market example is displayed on the daily USD/JPY currency chart above. The currency pair price declines in a bearish move before a temporary market bottom, price bounce and consolidation period where the pattern developes. The forex price cracks the support area and continues lower to reach the target price level which leads to trade completion.
Descending Triangle Short Timeframe Example
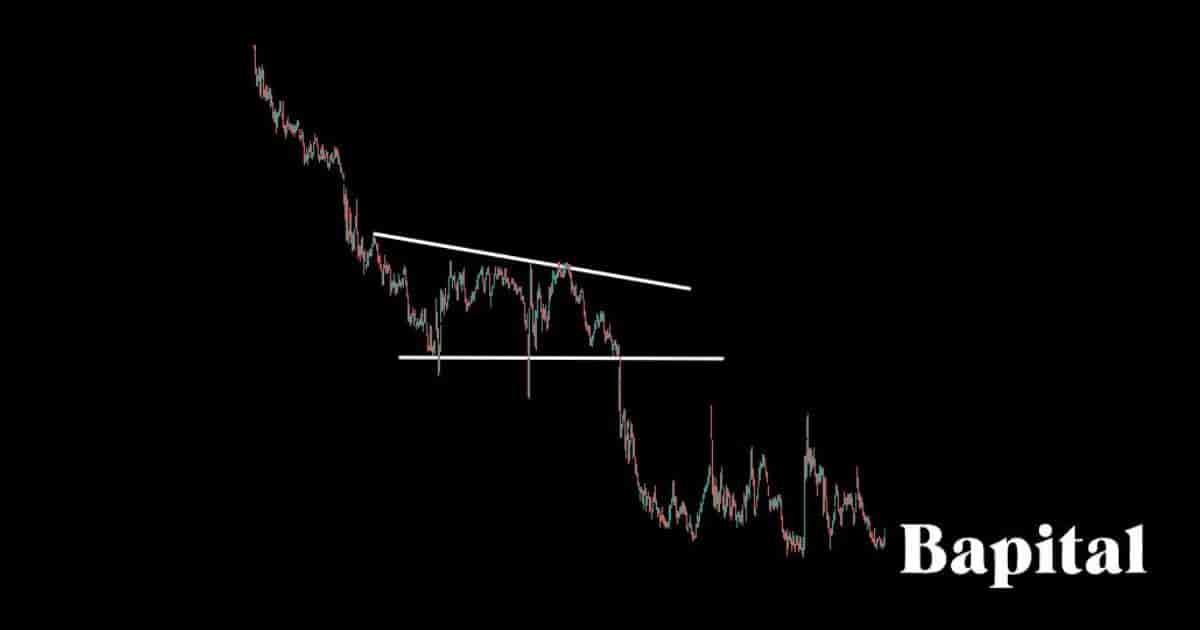
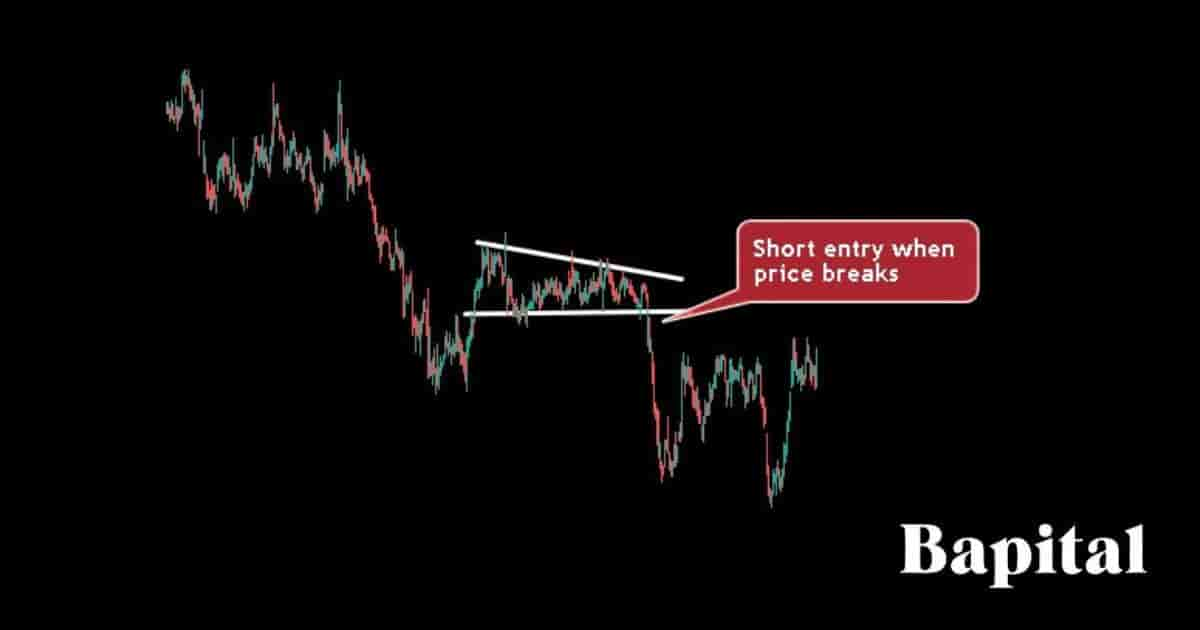
A descending triangle short timeframe example is shown on the 1 minute ETSY chart above. Etsy stock initially declines in a clear bearish trend before a price pause period where the pattern is created. Etsy stock price starts falling and a short trade is triggered when it passes the horizontal support point. The stock price falls to reach the target price point which completes the trade.
Descending Triangle Long Timeframe Example
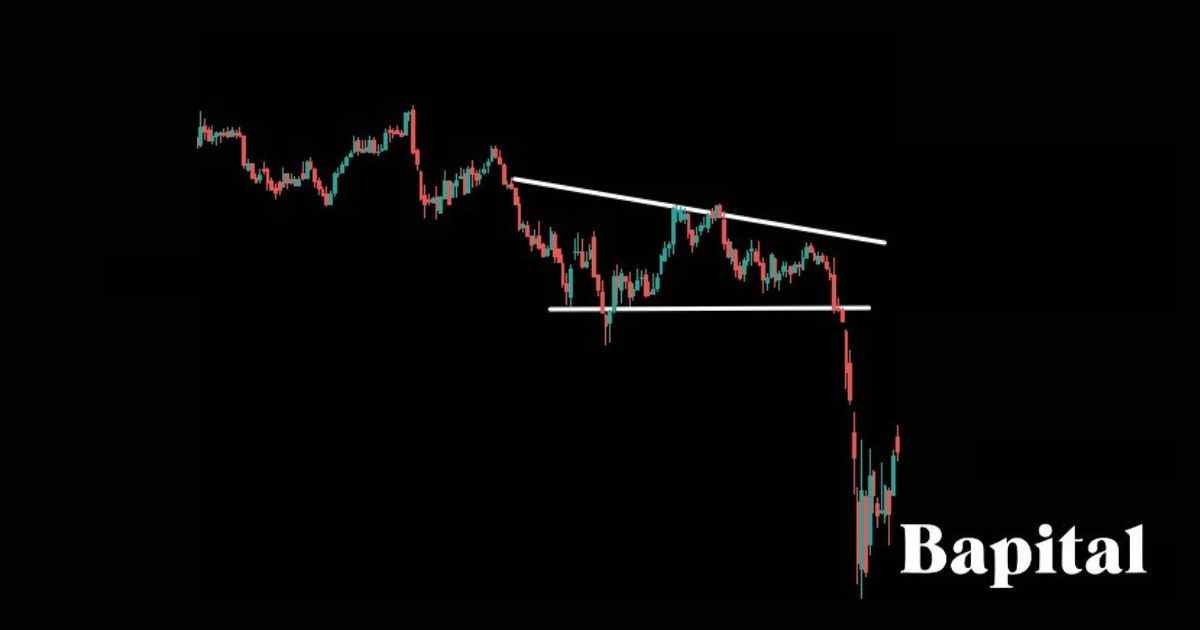
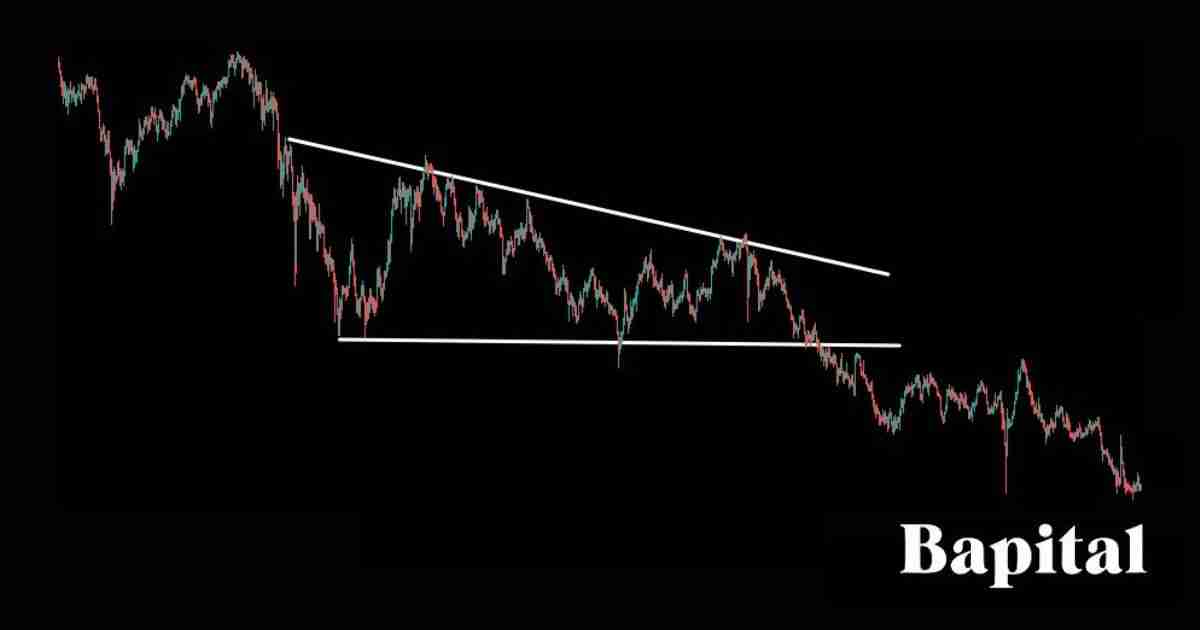
A descending triangle pattern long timeframe example is highlighted on the weekly market chart of Ford stock (F) above. Ford stock price falls in a declining trend before rebouncing and moving in a sideways range where the pattern formation occurs. The market stock price penetrates the support trendline where it moves lower on large selling volume and continues declining until it reaches the profit target area.
Descending Triangle Pattern Failure
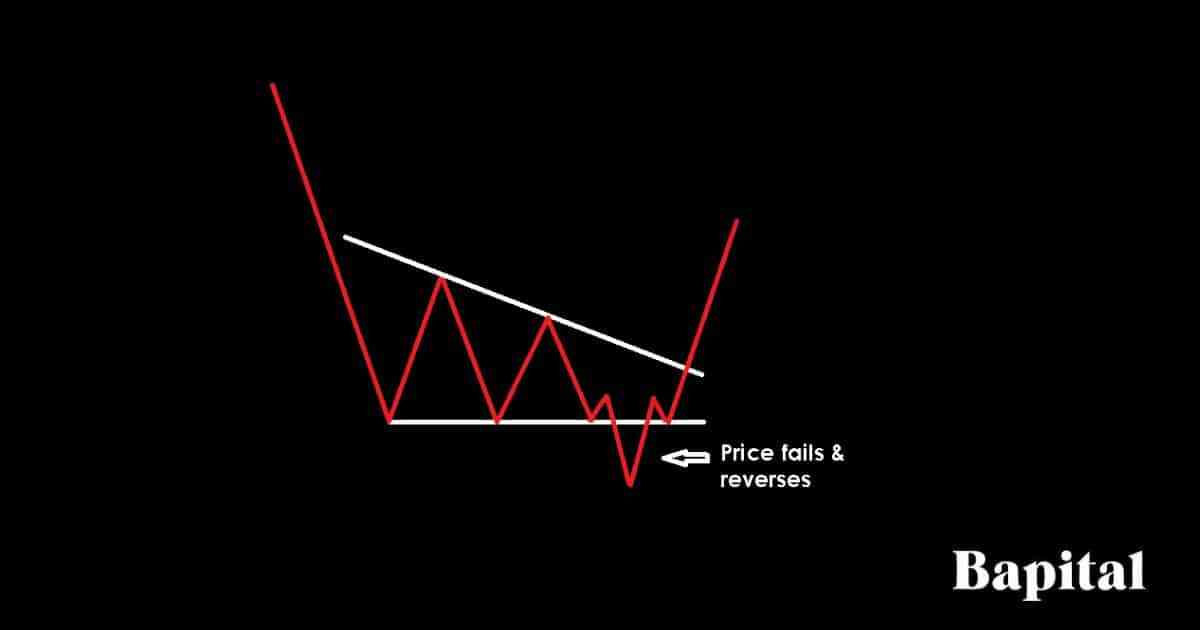
A descending triangle pattern failure, also known as a "failed descending triangle pattern", is when the descending triangle forms but market prices fail to continue lower. The descending triangle pattern is invalidated and fails when the market falls below the shorting trade entry point in a bearish movement but price reverses from below the pattern support level to trend upwards above the pattern's declining resistance level. A failed descending triangle pattern is a bullish signal.
Descending Triangle Pattern Failure Causes
The descending triangle pattern failure causes are below.
- Low Breakout Volume: A descending triangle can fail if there is low seller volume as price breaks lower. This low volume means a price reversal can occur and cause a failed pattern
- Unexpected Market News: A descending triangle fails if unexpected market news causes the asset price to surge upward
- Illiquid Markets: A descending triangle will fail if the financial market is illiquid with few market participants. Illiquid markets leads to trade slippage which can skew the reward-risk ratio negatively
Descending Triangle Pattern Benefits
The descending triangle pattern benefits are listed below.
- Helps Capture Large Bearish Trends: A descending triangle helps traders capture large bearish price trends from a low risk entry point
- Offers High Reward/Risk Ratio: Descending triangles offer a high reward to risk ratio, risking $1 to make $3+
- Multiple Market Application: Descending triangles are used in any capital market including stocks, futures, options, currencies, ETFs, cryptocurrencies, bonds, and indexes
- No Timeframe Restrictions: Descending triangles are used in any timeframe from short timeframe 1-second charts to yearly charts which means day traders, swing traders, and position traders trade using this pattern
- Works In Multiple Trading Strategies: Descending triangles can be applied to day trading strategies, scalping strategies, swing trading strategies, and long-term trading strategies without limitations
Descending Triangle Limitations
The descending triangle pattern limitations are below.
- False Signals: A descending triangle offers false signals which means the price of a market breaks down from the pattern and bounce back above the support level many times before the real breakdown to lower prices occurs
- Subjectivity: Interpreting descending triangle chart patterns involves a degree of subjectivity as different traders may identify patterns differently, leading to varied analysis and predictions
Descending Triangle Pattern Psychology
Descending triangle pattern psychology involves buy traders experiencing negative sentiment and pessimism as the market price is falling in a bearish direction. A small v-shape price bounce eventually occurs where buyers are optimistic of price appreciation. However, the price bounce is short lived with buyers and sellers both struggling to gain traction which causes a lack of confidence among traders. This is the consolidation period of the pattern.
This repeated failure to breach the resistance point of the consolidation area helps sellers gain confidence, anticipating a downward market trend continuation. The price weakening and dropping in a bearish trend direction causes panic among buyers while sellers are more optimistic and confident of further price depreciation.
Descending Triangles Frequently Asked Questions
Below are frequently asked questions about descending triangle chart patterns.
Are Descending Triangles Used In Technical Analysis or Fundamental Analysis?
Descending triangles are used for technical analysis of financial markets and not fundamental analysis.
Is a Descending Triangle Pattern Bullish or Bearish?
A descending triangle pattern is a bearish signal that indicates further price declines and downward price movements in global markets.
What's The Differences Between a Descending Triangle vs Falling Wedge Pattern?
The descending triangle pattern differences with a falling wedge pattern are its shape and what it signals. Descending triangles are shaped with a downward slanted resistance level and a straight horizontal support level while a falling wedge has a downward sloping resistance line and a slightly downward sloping support trendline. Secondly, a descending triangle pattern is a bearish signal while a falling wedge is a bullish signal.
What's The Difference Between a Descending Triangle vs Bear Flag?
The descending triangle pattern difference with a bear flag is its shape with a descending triangle shaped with a horizontal support line and declining resistance line while a bear flag is shaped with a downward flagpole and two parallel rising support and resistance lines.
What's The Differences Between a Descending Triangle vs Bull Flag?
The descending triangle pattern differences with bull flag chart patterns are its shape and what is signals. A descending triangle is shaped with a declining resistance level and horizontal support while a bull flag is shaped with a upward sloping flagpple and two parallel declining support and resistance lines. Secondly, a descending triangle is a bearish signal while a bull flag is a bullish signal.
Is a Descending Triangle a Continuation or Reversal Pattern?
Descending triangle patterns are bearish continuation chart patterns that signal further price decreases in the same trend direction as the underlying price trend.
How Accurate Is a Descending Triangle Pattern?
The descending triangle pattern's accuracy rate is 42% from our historical backtesting data of 1,395 of these chart pattern formations on daily timeframe charts.
What Technical Analysis Indicators Are Used With Descending Triangles?
Descending triangles are used with trading technical indicators including the volume indicator, moving average overlays, R.S.I. oscillator, moving average convergence divergence (MACD), Keltner channels, Bollinger bands, aveage true range, and average daily range.
How Long Does a Descending Triangle Pattern Take To Form?
A descending triangle pattern takes a minimum of 60 minutes to form on a 1-minute price chart up to a minimum of 60 years to form on a yearly price chart. To calculate the descending triangle pattern formation time, multiple the chart timeframe used by 60. For example, a 30-minute timeframe price charts means a descending triangle will take a minimum of 30 hours (30 minutes x 60) to form.
How Often Do Descending Triangle Patterns Form?
Descending triangles form 5-8 times per year on daily market charts in bearish market environments.
What Timeframe Price Charts Do Descending Triangles Form On?
Descending triangle patterns form on all timeframes from short-term tick charts to longer-term yearly price charts.
What Type Of Traders Use Descending Triangles?
Descending triangle patterns are used by day traders, swing traders, position traders, professional technical analysts (chartered market technicians), and active investors.
How Do Traders Find Descending Triangle Patterns?
Descending triangles are found in the market by browsing price charts manually, using a charting pattern scanner, or scanning well-known chart pattern traders twitter feeds.
What's The Opposite Of a Descending Triangle Pattern?
The descending triangle pattern's opposite is the bullish ascending triangle pattern which is shaped like an inverted descending triangle.
What Are Other Bearish Patterns?
Apart from descending triangles, other bearish chart patterns are listed below.
