What Is a Diamond Pattern In Technical Analysis?
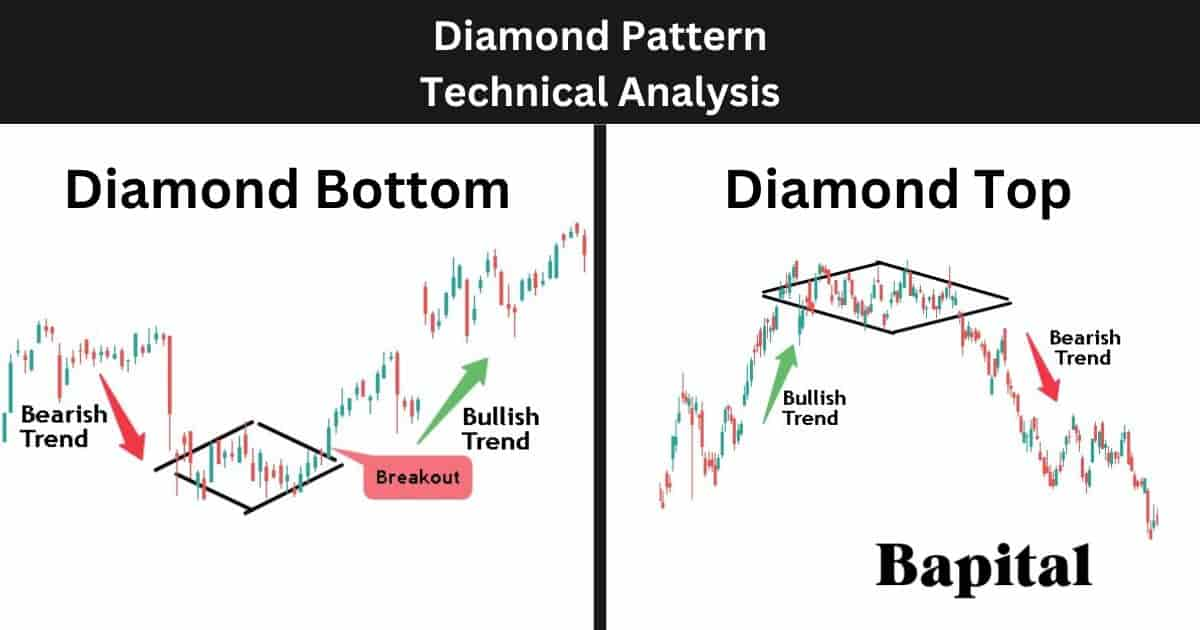
A diamond pattern is a reversal pattern in technical analysis that signals a bearish price reversal at a market top or a bullish price reversal at a market bottom. Diamond patterns resemble the shape of a diamond on a price chart with symmetrical upper and lower trendlines meeting at a point to form the diamond shape. A diamond pattern forming at a market top is called a diamond top and a diamond pattern forming at a market bottom is called a diamond bottom.
What Are The Types Of Diamond Patterns In Technical Analysis?
The two diamond pattern types are the diamond top pattern and the diamond bottom pattern.
1. Diamond Top Pattern
A diamond top pattern is a bearish pattern that signals a bullish to bearish price reversal from an uptrend to a downtrend. Diamond tops form at a market top at the end of a bullish trend and are a bearish signal. A diamond top pattern is shaped like a diamond on a price chart. The diamond top pattern's alternative name is "bearish diamond top".
2. Diamond Bottom Pattern
A diamond bottom pattern is a bullish pattern that signals a bearish to bullish price reversal from a downtrend to an uptrend. Diamond bottoms form at a market bottom at the end of a bearish trend and are a bullish signal. A diamond bottom pattern is shaped like a diamond on a price chart. The diamond bottom pattern's alternative name is "bullish diamond bottom".
What Does a Diamond Pattern In Technical Analysis Mean?
A diamond pattern in technical analysis means that a market reversal is expected with the market price changing direction from bullish to bearish or bearish to bullish.
What Does a Diamond Top Pattern Mean?
A diamond top pattern means a bearish price reversal is expected with the market price changing from a bull trend with rising prices to a bear trend with declining prices.
What Does a Diamond Bottom Pattern Mean?
A diamond bottom pattern means a bullish price reversal is expected with the market price changing from a downward trend with decreasing prices to a upward trend with increasing prices.
What Is The Importance Of a Diamond Pattern In Technical Analysis?
The diamond pattern is important in technical analysis for indicating price reversals and it is important for indicating buyer exhaustion at the end of a bull run or seller exhaustion at the end of a bearish move.
What Is The Importance Of a Diamond Top Pattern?
The diamond top pattern is important for signaling bearish market reversals and buying exhaustion at the end of a bullish trending move.
What Is The Importance Of a Diamond Bottom Pattern?
The diamond bottom pattern is important for signaling bullish market reversals and selling exhaustion at the end of a bearish trending move.
What Are The Components Of a Diamond Pattern?
The four diamond pattern components are left upward sloped resistance trend line, right downward sloped resistance trend line, left downward sloped support line, and right upward sloped support trend line. These are both the diamond top components and diamond bottom components.
1. Left Upward Resistance Trendline
The diamond pattern's left upward sloped resistance line is a resistance line pointing upwards that connects higher swing high prices together. It is located on the top left-hand side of the pattern.
2. Right Downward Resistance Trendline
The diamond pattern's right downward sloped resistance line is a resistance line pointing upwards that connects higher swing high prices together. It is located on the top left-hand side of the pattern.
3. Left Downward Support Trendline
The diamond pattern's left downward sloped support line is a declining support trendline that connects lower swing low prices together. It is located on the bottom left-hand side of the pattern.
4. Right Upward Support Trendline
The diamond pattern's right upward sloped support line is a rising support line that connects higher swing low prices together. It is located on the bottom right-hand side of the pattern.
What Is The Formation Process Of a Diamond Pattern?
The diamond pattern's formation process begins with the formation of an underlying bullish or bearish price trend. As the market trend gets extended, the asset price compresses in a narrow range. Initially, within the price range, the asset price forms higher swing high peaks and lower swing low troughs forming the left-hand side upper resistance line and lower support line of the diamond pattern. Then, the price action forms lower swing high peaks and higher swing low troughs forming the right-hand side upper resistance line and lower support line of the pattern.
What Is The Formation Process Of a Diamond Top Pattern?
The diamond top pattern's formation process begins with the formation of an underlying bullish price trend with financial markets forming higher swing low prices and higher swing high prices in an upswing direction.
As the bullish trend extends, the market price consolidates within a price range. Within this price range phase, the security price forms higher swing highs which marks the diamond top's left-hand resistance zone component and lower swing low prices which forms the diamond top's left-hand side support zone.
Then, the market price forms declining swing high peaks which marks the diamond top's right-hand resistance area and rising swing low troughs which marks the diamond top's right-hand side support area completing the diamond top formation.
What Is The Formation Process Of a Diamond Bottom Pattern?
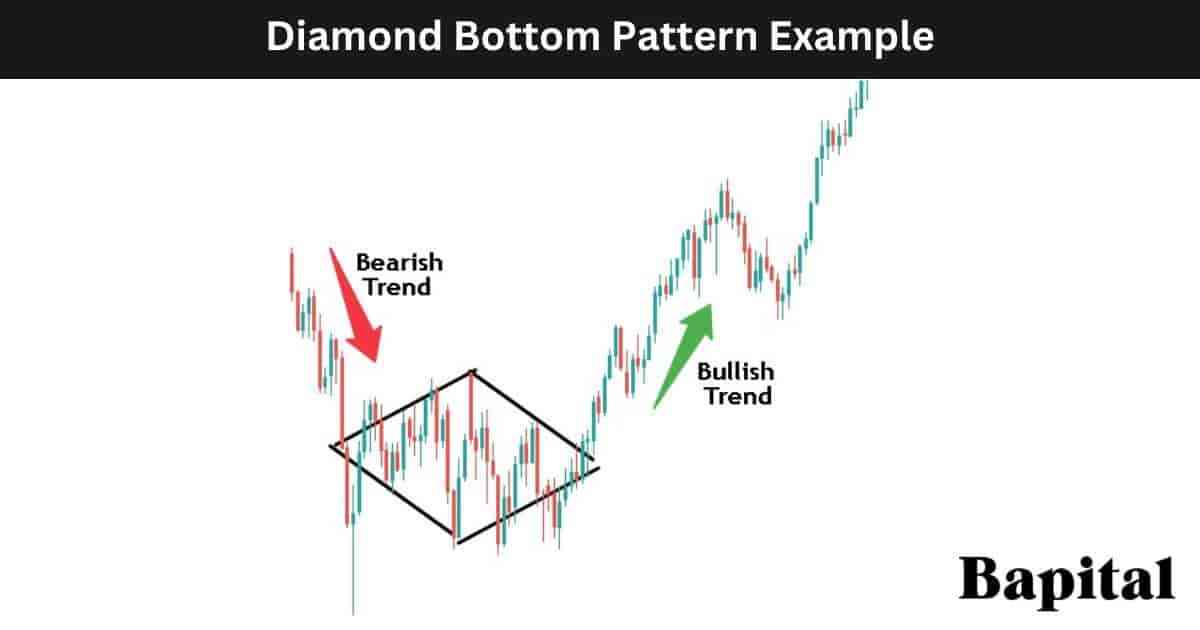
The diamond bottom pattern's formation process begins with the formation of an underlying bearish price trend with capital markets forming decreasing swing low prices and decreasing swing high prices in a downswing direction.
As the bearish trend exhausts, the market price consolidates in rangebound price action. Within this rangebound market condition after a bear trend, the asset's price forms increasing swing high peaks which marks the diamond bottom's left-hand side resistance area and decreasing swing troughs which marks the diamond bottom's left-hand side support area.
Then, the financial instrument's price forms decreasing swing high prices which marks the diamond bottom's right-hand side resistance zone and increasing swing low prices which marks the diamond bottom's support trendline completing the diamond bottom formation.
What Happens After a Diamond Pattern Forms?
After a diamond pattern forms, the market price reverses from bullish to bearish at a market top or from bearish to bullish at a market bottom.
What Happens After a Diamond Top Pattern Forms?
After a diamond top pattern forms, the asset price reverses from trending upward in a bullish direction to trending downward in a bearish direction once the price breaks below the diamond top support point.
What Happens After a Diamond Bottom Pattern Forms?
After a diamond bottom pattern forms, the financial instrument price reverses from declining prices in a bearish direction to rising prices in a bullish direction once the price breaks out above the diamond bottom resistance point.
What Causes a Diamond Pattern To Form In Technical Analysis?
A diamond pattern is caused by volatility contraction after a strong upward or downward trend with the price fluctuating in a narrow trading range.
How Long Does a Diamond Pattern Take To Form In Technical Analysis?
A diamond pattern takes a minimum of 40 days to form on a daily timeframe price chart. To calculate the diamond pattern formation duration, multiple the timeframe used by 40. For example a diamond pattern on a 30-minute price chart would take a minimum of 1,200 minutes (30 minutes x 40) to form. This 40 day duration on a daily timeframe chart applies to both diamond tops and diamond bottoms.
How Often Do Diamond Patterns Form In Technical Analysis?
The diamond pattern forms between 2 to 6 times per year on the daily timeframe price chart depending on market conditons with shorter intraday price charts seeing the diamond pattern form more frequently.
How Often Do Diamond Top Patterns Form?
The diamond top pattern forms between 4 to 6 times per year on the daily timeframe market chart in bullish trending price action markets.
How Often Do Diamond Bottom Patterns Form?
The diamond bottom pattern forms between 2 to 4 times per year on the daily timeframe finance chart in bearish trending price action markets.
What Type Of Price Charts Do Diamond Pattern Form On?
Diamond patterns form on candlestick charts, line charts, bar charts, and open high low close (OHLC) charts.
What Markets Do Diamond Patterns Form In?
The diamond pattern forms in all global financial markets including stock markets, future markets, bond markets, commodity markets, options markets, forex markets, indices, and cryptocurrency markets.
What Timeframe Price Charts Do Diamond Patterns Form On?
The diamond pattern forms on all timeframes from short intraday timeframe tick charts up to higher timeframe yearly price charts.
How To Identify a Diamond Pattern In Technical Analysis
Diamond pattern identification begins with identifying a financial instrument in a strong bull trend or strong bear trend and a price pause and consolidation period. As the market consolidates, price fluctuates making higher swing highs and lower swing lows before compressing further leading to lower swing highs and higher swing lows resulting in a diamond shape being identified on the market chart.
How To Identify a Diamond Top Pattern
The diamond top pattern is identified after a strong upward bullish price movement and price exhaustion as prices struggles to move higher. A price retracement and rangebound period occurs with the diamond pattern shape being identified during this consolidation time horizon after buying exhaustion.
How To Identify a Diamond Bottom Pattern
The diamond bottom is identified after a large bearish downward trending move and a reduction in selling momentum. Price consolidates at the market bottom and forms the diamond shape leading to the diamond bottom being identified.
How Do Traders Find Diamond Patterns In Financial Markets?
Diamond pattern formations are found by scanning the financial markets with a diamond pattern charting screener, checking the online profiles of top traders, chartists, or expert chartered market technicians (CMT), browsing the market charts manually, or by checking trading broker software.
How Do Traders Scan For Diamond Patterns?
Diamond pattern scanning involves traders using the Finviz.com diamond pattern scanner, using a custom script to scan finance charts, using TradingView chart pattern scanner, or using StockCharts chart pattern screener.
How Do Traders Draw A Diamond Pattern?
A diamond pattern drawing begins with identifying a price consolidation period after an uptrend or downtrend. Draw an upward sloping trendline from left to right connecting the higher swing high prices together. Then, draw a downward sloping trendline connecting the lower swing low prices together. This completes the drawing of the left-hand side of the pattern.
Draw a downtrending trendline from left to right connecting the lower swing high prices together. Then, draw an uptrending trendline from left to right connecting the higher swing low price points together. This completes the drawing of the right-hand side of the pattern.
How To Trade a Diamond Pattern In Technical Analysis
Diamond pattern trading involves entering a trade position when the market price breaks out of the pattern consolidation area. Place a stop loss order at the breakout candlestick price low for a diamond bottom or at the breakout candlestick price high for a diamond bottom. Measure the height of the pattern from resistance to support to calculate the trade profit target area.
How To Trade a Diamond Top Pattern
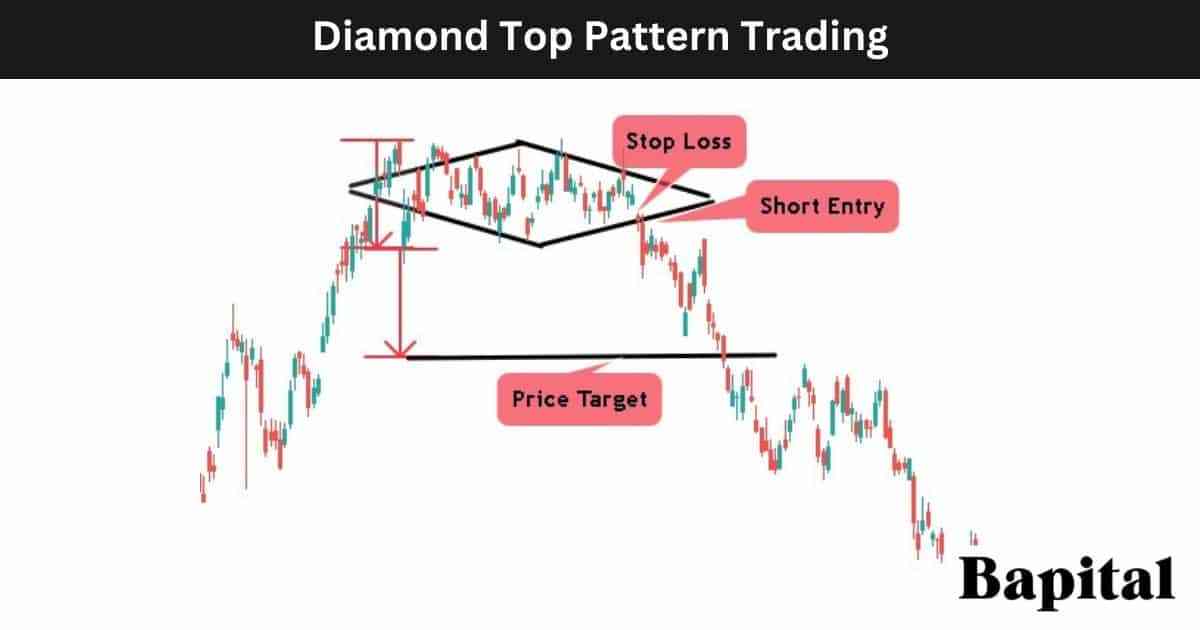
The diamond top pattern trading steps are listed below.
- Identify the diamond top in a market
- Enter a short trade on pattern breakdown
- Set diamond top price target order
- Place a stop loss above breakdown candlestick
1. Identify the Diamond Top On A Price Chart
The first diamond top pattern trading step is to identify the diamond top in a financial instrument. Use chart pattern scanners or browse through market charts manually to find diamond tops in live market environments.
2. Enter Short Trade After Pattern Breakdown
The second diamond top pattern trading step is to enter a short trade when the market price drops below the pattern support point. Watch for increasing sell volume as the price is falling.
What Is the Diamond Top Entry Point?
The diamond top entry price is when the market price falls below the pattern support line with increasing selling momentum.
3. Set the Diamond Top Price Target Order
The third diamond top trading step is to set a price target order for the diamond top by calculating the height between the resistance price and the support price and subtracting this number from the sell trade entry price.
What Is the Diamond Top Price Target?
The diamond top target is set by measuring the distance between the high and low of the pattern and subtracting this from the shorting price to get the profit target level.
What Is The Diamond Top Pattern Price Target Calculation Formula?
The diamond top pattern price target formula is: Diamond Top Price Target = Short Entry Price - Pattern Height.
4. Place a Diamond Top Stop-Loss Order Above Breakdown Candlestick
The fourth diamond top trading step is to place a stop-loss order above the highest price of the breakdown candlestick.
What Is The Risk Management Of A Diamond Top?
A diamond top pattern risk management is set by placing a stop-loss order above the breakdown candlestick's highest price. Traders typically risk 1% trading capital when trading diamond tops and adjust their position size to represent this risk amount.
What Is The Risk/Reward Ratio When Trading Diamond Top Patterns?
A diamond top pattern risk/reward ratio is 2.6:1 (risk $1 to return $2.60+).
How To Trade a Diamond Bottom Pattern
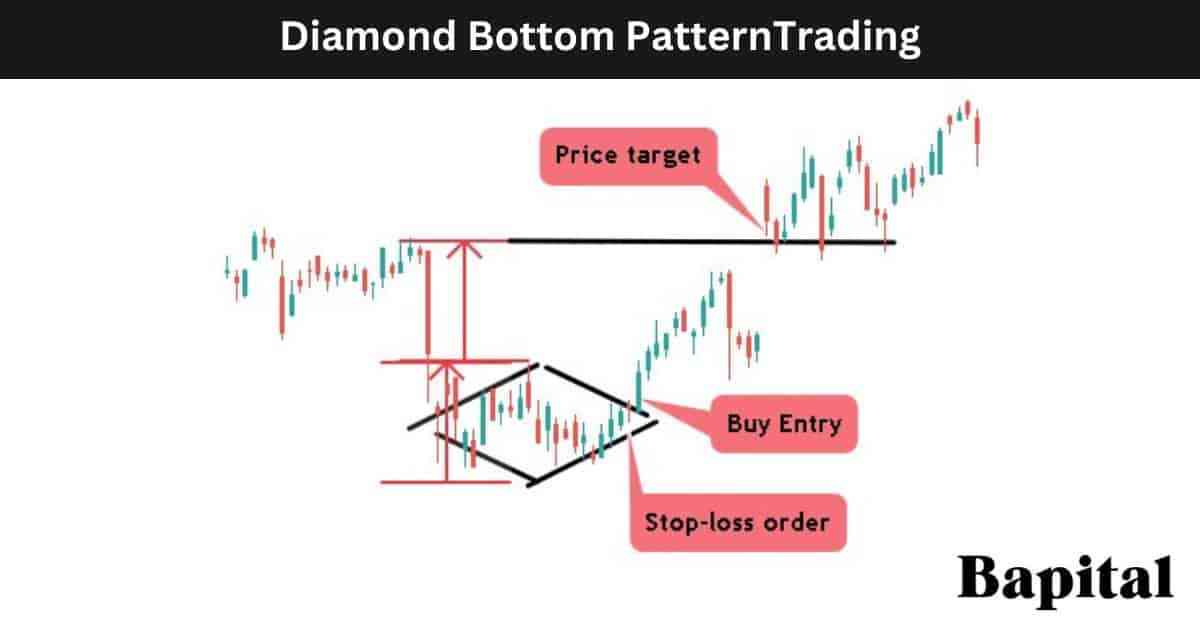
The diamond bottom pattern trading steps are listed below.
- Identify a diamond bottom on price chart
- Enter buy trade after pattern breakout
- Set diamond bottom price target order
- Place stop-loss below breakout candlestick
1. Identify the Diamond Bottom On A Price Chart
The first diamond bottom pattern trading step is to identify the diamond bottom in a market. Use chart pattern screeners to find diamond bottoms in real-time market conditions.
2. Enter Buy Trade After Pattern Breakout
The second diamond bottom pattern trading step is to enter a long trade position as the market price breaks above the pattern resistance point on increasing buyer momentum.
What Is A Diamond Bottom Entry Point?
A diamond bottom pattern entry is when the price rises through the pattern's right-hande resistance trendline.
3. Set the Diamond Bottom Price Target Order
The third diamond bottom pattern trading step is to set a price target order by measuring the height between the pattern resistance and support points and adding this number to the long entry price.
What Is the Diamond Bottom Price Target?
The diamond bottom target is set by calculating the distance between the pattern high and low and adding this number to the buy entry price level.
What Is The Diamond Bottom Pattern Price Target Calculation Formula?
The diamond bottom pattern price target formula is: Diamond Bottom Price Target = Buy Entry Price + Pattern Height.
4. Place Stop-Loss Order Below Breakout Candlestick
The fourth diamond bottom pattern trading step is to place a stop-loss order below the breakout candelstick's price low.
What Is The Risk Management Of A Diamond Bottom?
A diamond top pattern risk management is set by placing stop market order or stop limit order at the breakout candlestick lowest price. Traders typically risk 1% trading capital per trade.
What Is The Risk/Reward Ratio When Trading Diamond Bottom Patterns?
A diamond bottom pattern risk/reward ratio is 2.9:1 (risk $1 to return $2.90+).
What Are The Risks When Trading a Diamond Pattern?
The diamond pattern trading risks are the risk of the price gapping up or down against the trade position direction, diminishing market liquidity, and volatility increasing causing large price sikes and price drops.
What Are The Common Mistakes When Trading a Diamond Pattern?
The diamond pattern common trading mistakes are using too much leverage, not analysing upcoming market news events prior to trade entry, and poor trade position management.
What Is a Diamond Pattern Trading Strategy?
A diamond top pattern trading strategy is the U.S. market securities trailing stop diamond top strategy. Scan the daily timeframe candlestick price charts of U.S. equities for diamond top patterns using a chart pattern screener. Place a 10 exponential moving average overlay on the chart where the diamond top forms. Enter a shorting trade position when the security price penetrates the support trendline on rising seller volume (red bars). Place a trailing stop-loss order above the high price of the breakdown candlestick. Trail the stop loss lower as the price drops. Exit the short trade position when the market price closes above the 10EMA moving average.
A diamond bottom pattern trading strategy is the U.S. market equities trailing stop diamond bottom strategy. Scan the daily timeframe candlestick charts of U.S. stocks for diamond bottom patterns using a chart pattern recognition scanner. Place a 10 exponential moving average (EMA) overlay on the chart. Enter a buy trade positon when the market security penetrates above the resistance line on rising buyer volume (green bars). Place a trailing stop market order below the 10EMA price and trail the stop upwards as the price increases. The trade exit occurs when the candlestick bar closes below the 10EMA.
What Type Of Trading Strategies Can Diamond Patterns Be Traded In?
The diamond pattern is traded in scalping strategies, day trading strategies, swing trading strategies, position trading strategies and investment strategies.
What Are Diamond Pattern Trading Rules?
The diamond pattern trading rules are listed below.
- Employ strict risk management rules when entering a trade position
- Avoid trading before or during important economic or corporate news events
- Calculate the trade position size prior to trade entry
- Adapt to the market price action dynamically
- Avoid excessive leverage use
- Utilize cutting-edge pattern recognition software to find diamond patterns quickly
- Monitor the buyer and seller volume after a pattern breakout
- Correlate the diamond pattern formation with broader market economic events
What Types Of Traders Trade Diamond Patterns?
The diamond pattern traders include scalpers, day traders, swing traders, position traders, professional technical analysts, and active investors.
What Are Examples Of Diamond Patterns In Technical Analysis?
The diamond chart pattern historical examples are below.
Diamond Top Pattern Example
A diamond top pattern stock market example is illustrated on the daily stock chart of Ford (F) stock above. The stock price initially rises in a bull trend before consolidating and forming the diamond top. The Ford stock price drops below the support level and continues falling lower in a downward movement.
Diamond Bottom Pattern Example
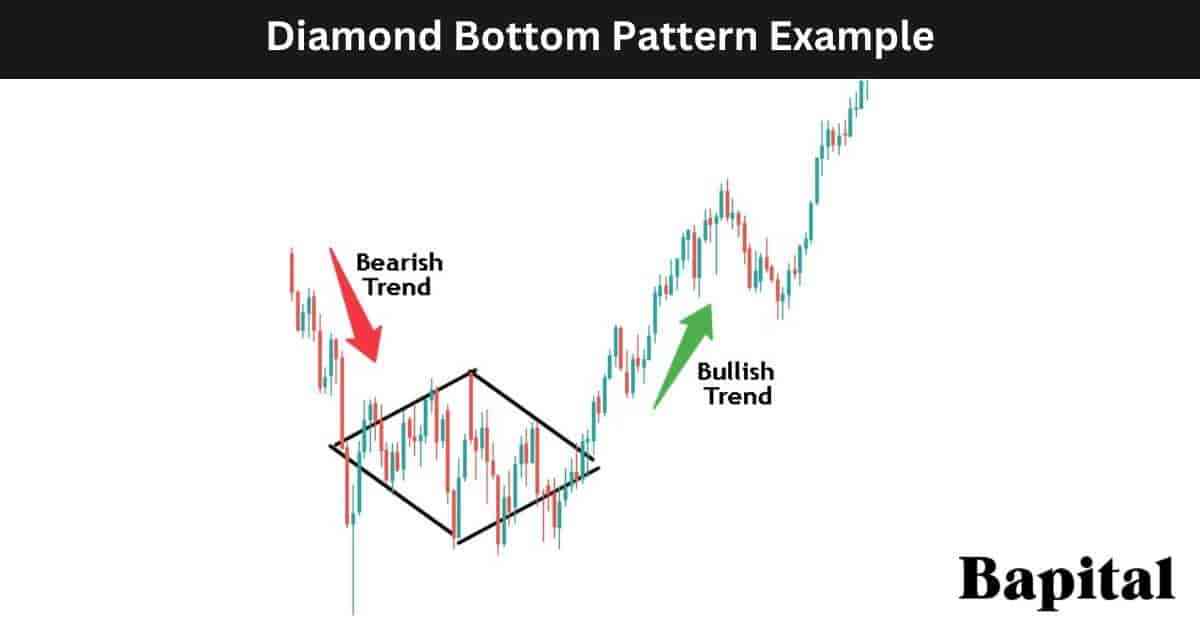
A diamond bottom pattern futures market example is display on the weekly futures chart of Crude Oil above. The futures price initially drops lower in a declining trend before a price bounce and consolidation forms a diamond bottom. The Crude Oil price coils and breaks out of the pattern and trends higher in an upward movement.
What Are The Benefits Of a Diamond Pattern?
The diamond pattern benefits are it helps traders identify price trend reversals in markets, universal market and timeframe application, high return to risk ratio, and it is easy for beginner traders to understand.
What Are The Benefits Of a Diamond Top Pattern?
The diamond top pattern benefits are listed below.
- Helps predict bearish price reversals: A diamond top pattern helps traders to find shorting opportunities and it predicts bearish price reversals in the markets
- Helps traders understand the end of a bullish trend: A diamond top pattern helps traders to take profits on any bullish trades as the pattern signals that the bullish trend is ending and that the price will reverse
- Offers low-risk short entries: A diamond top pattern offers a short entry in a favorable low-risk area with the potential for a large bearish move lower. This implies that traders can enjoy a favorable risk-reward ratio, where the potential reward outweighs the risk taken in the trade, enhancing the attractiveness of this pattern trading strategy
- Multiple market application: A diamond top pattern is applied to any capital market including futures, stocks, options, ETFs, cryptocurrencies, commodities, forex, and bonds without limitation
- Multiple timeframe application: A diamond top pattern is applied to any timeframe from tick charts to 1-second price charts to yearly price charts without limitations
What Are The Benefits Of a Diamond Bottom Pattern?
The diamond bottom pattern benefits are listed below.
- Helps find bullish price reversals: A diamond bottom pattern helps a trader spot potential price reversals in the market
- Offers a high reward to risk ratio: A diamond bottom pattern offers a low-risk to high reward ratio of a reward of $2.90+ for every $1 risk
- Universal market application: A diamond bottom pattern forms in all global markets with no market restrictions
- Easy to understand: The diamond bottom pattern is relatively easy for new traders to understand with just four components required to learn
What Are The Limitations Of a Diamond Pattern?
The diamond pattern limitations are listed below. These limitations are both diamond top limitations and diamond bottom limitations.
- False signals: The diamond pattern generates false signals and false breakouts which can cause large capital losses if risk managemenet procedures are not followed
- Subjective interpretation: The diamond pattern is subjective and a traders interpretation can differ from one trader to the next. This can lead to incorrect entry prices and stop loss placement
- Fails in volatile markets: The diamond pattern fails in higher volatility markets with choppy sideways price action which increases trading capital losses
What Is a Diamond Pattern Failure In Technical Analysis?
A diamond pattern failure is when the market price breaks out from the pattern but fails to continue trending in the breakout direction and reverses. The diamond pattern is invalidated and fails when the market price breaks out of the pattern but reverses and moves back inside the pattern in the opposite price direction.
What Is a Diamond Top Pattern Failure?
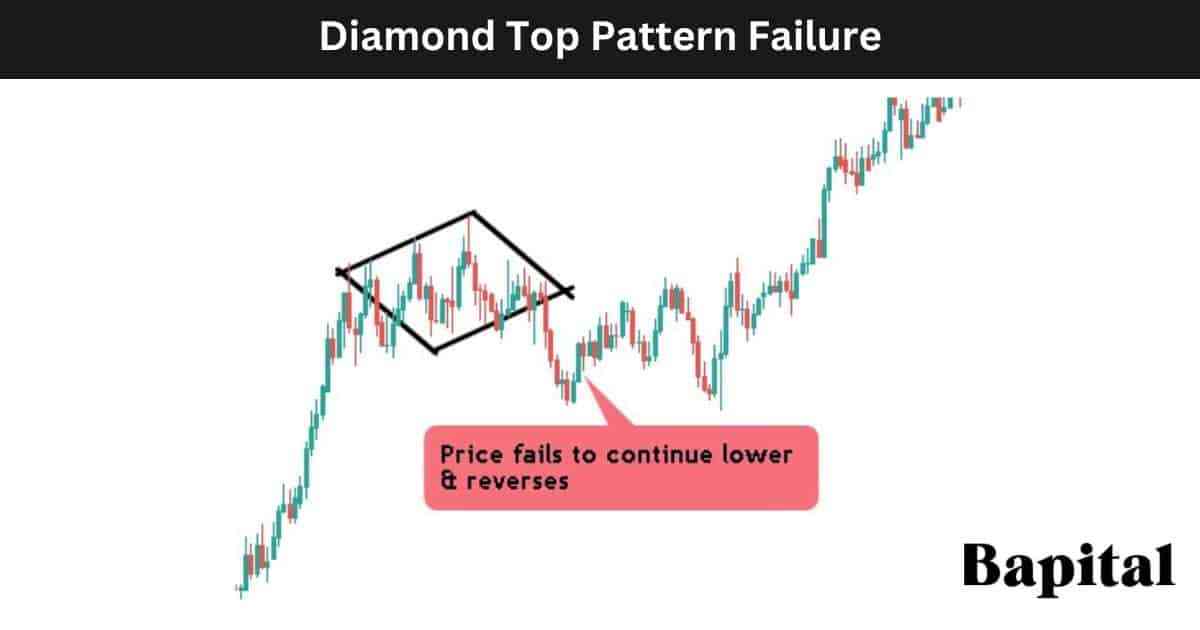
A diamond top pattern failure, also known as a "failed bearish diamond", is when a diamond top forms but fails to reverse to lower prices. The diamond top pattern is invalidated and fails when the asset price drops and breaks down below the short entry price in a bearish movement but quickly reverses from below the support area to trend higher above the pattern's resistance level in a bullish direction. A failed diamond top is a bullish signal.
What Causes a Diamond Top Pattern To Fail?
The diamond top pattern failure causes are below.
- Unexpected bullish news: Unexpected bullish/positive news can cause an upward price spike leading to the diamond top failing
- Lack of selling volume: Low selling volume after a price breakdown can cause the diamond top to fail as there is no selling conviction
- Illiquid markets: Illiquid markets with low trading volume can cause the diamond top pattern to fail as there is little volume to get the right entry price which means order slippage issues
What Is a Diamond Bottom Pattern Failure?
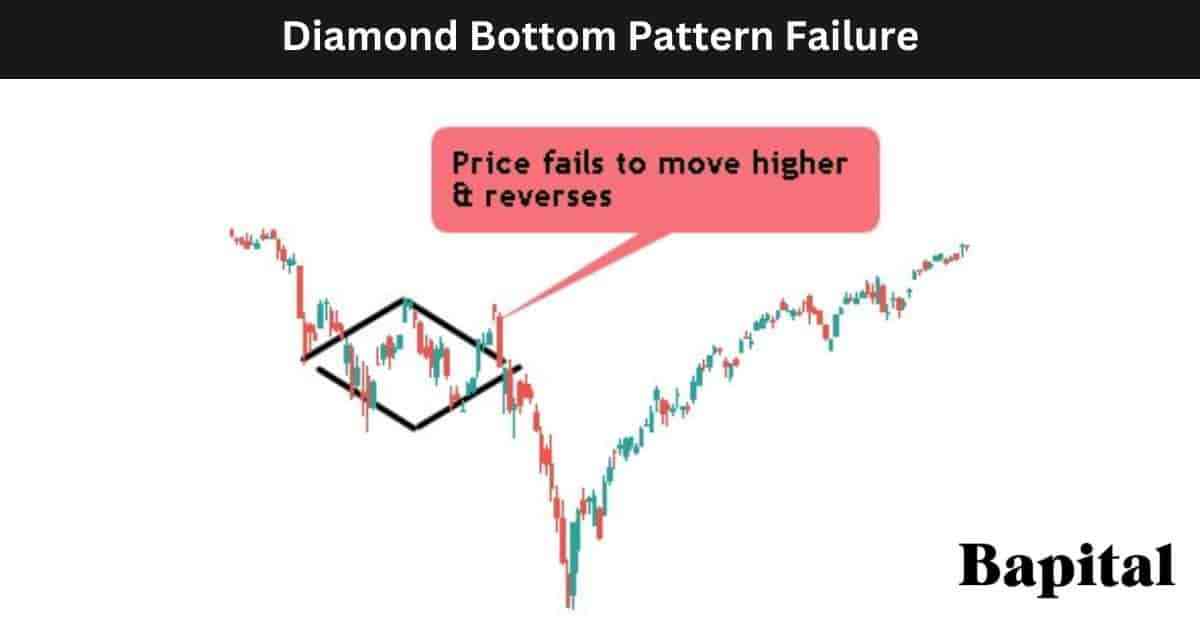
A diamond bottom pattern failure, also known as a "failed bullish diamond", is when a diamond bottom forms but fails to reverse to higher prices. The diamond bottom pattern is invalidated and fails when the security price rises and breaks out above the buy entry price in a bullish movement but quickly reverses from above the resistance area to trend lower below the pattern's support level in a bearish direction. A failed diamond bottom is a bearish signal.
What Causes a Diamond Bottom Pattern To Fail?
The diamond bottom pattern failure causes are below.
- Unexpected bearish news: Unexpected bearish/negative news can cause a downward price spike leading to the diamond bottom failing
- Lack of buying volume: Low buying volume after a price breakout can cause the diamond bottom to fail as there is no buyer conviction in a strong bullish move higher
- High volatility markets: A highly volatile market can cause a diamond bottom pattern to fail as price fluctuates wildly up and down can stop loss orders to be triggered
What Technical Indicators Are Used With Diamond Patterns?
A diamond pattern is used with technical indicators including the exponential moving average overlay, volume indicator, volume weighted average price (VWAP), relative strength index (RSI) trading indicator, average daily range (ADR), average true range (ATR), elliott waves, keltner channels, volume profile, advance decline line, moving average convergence divergence (MACD), on balance volume (OBV), and bollinger bands in technical analysis.
What Technical Indicator Is Used As A Confirmation Signal With a Diamond Pattern?
The diamond pattern's confirmation technical indicator is the volume indicator as it confirms the presence of large buyers and large sellers after a pattern breakout.
What Is The Psychology Behind a Diamond Pattern In Technical Analysis?
The diamond top pattern psychology involves a shift from bullish optimism to uncertainty as the price oscillates. Bulls remain hopeful for the uptrend, while bears become active, sensing overvaluation. The pattern forms as prices create a series of peaks and troughs, signaling indecision. A market breakdown below the pattern's lower boundary confirms the reversal, triggering fear-driven selling as traders exit long positions or initiate shorts. This shift reflects a transition from bullish to bearish sentiment, with fear and uncertainty driving the downward pressure on prices.
The diamond bottom pattern psychology involves a shift from bearish sentiment to cautious optimism. Initially, bears dominate, pushing prices lower as pessimism prevails. However, as the downtrend progresses, uncertainty arises as sellers begin to question further downside sustainability. The pattern forms as prices create a series of peaks and troughs, indicating indecision. A market breakout above the pattern's upper boundary confirms the reversal, triggering buying interest as traders exit short positions or initiate long trade positions. This shift reflects a transition from bearish to bullish sentiment, with renewed optimism driving upward pressure on prices.
What Are Statistics Of the Diamond Pattern?
The diamond pattern statistics are displayed below.
How Accurate Is a Diamond Top Pattern?
A diamond top pattern's accuracy rate is 38% from 904 of these chart pattern formations.
How Accurate Is a Diamond Bottom Pattern?
A diamond bottom pattern's accuracy rate is 41% from our backtesting data of 1,052 of these chart pattern formations.
Are Diamond Patterns Reliable?
Yes, diamond patterns are reliable provided traders follow the trading rules and avoid using excessive trading leverage.
What Market Conditions Is a Diamond Pattern Most Reliable?
The diamond pattern is most reliable in trending market conditions with the market price trending upwards or trending downward in a clear direction.
What Market Conditions Is a Diamond Pattern The Least Reliable?
The diamond pattern is the least reliable in volatile market conditions with the price fluctuating wildly both upwards and downwards in no clear trend direction.
Is a Diamond Top Pattern Profitable?
Yes, a diamond top pattern is profitable as the average success rate is 38% and the average return to risk ratio is 2.6 to 1. This means for every 100 trades, a trader wins 38 trades making 2.6 units (98.8 units total) and loses 62 trades losing 1 unit (62 units total). Therefore, over 100 trades, a trader should hypothetically net 36.8 units (98.8 units - 62 units). Be aware that past performance is not indicative of future trade results and these backtesting results do not account for order slippage or trading related fees.
Is a Diamond Bottom Pattern Profitable?
Yes, a diamond bottom pattern is profitable as the average success rate is 41% and the average return to risk ratio is 2.9 to 1. This means for every 100 trades, a trader wins 41 trades making 2.9 units (118.9 units total) and loses 59 trades losing 1 unit (59 units total). Therefore, over 100 trades, a trader should hypothetically net 59.9 units (118.9 units - 59 units). Be aware that historical performance is not indicative of future trading results and these backtesting results do not account for order slippage or trading/broker related fees.
What Are Alternatives To Diamond Patterns?
The diamond pattern alternatives are below.
- Bump & run reversal chart pattern
- Triple top
- Rising wedge price pattern
- Rounded bottom price pattern
- Rounded top pattern
- Channels
- Gap pattern
What Is The Opposite Of a Diamond Pattern?
The diamond pattern's opposites are the double top pattern and the double bottom pattern.
What Are Diamond Pattern Resources To Learn From?
Diamond pattern resources to learn from include books, websites, pdfs and courses.
What Are Books To Learn About Diamond Patterns?
Diamond pattern books to learn from are "Technical Analysis of Financial Markets" by technical analyst John Murphy and "The Ultimate Guide to Chart Patterns by Steve Burns and Atanas Matov.
What Are Websites To Learn About Diamond Patterns?
Websites to learn about diamond patterns are Bapital.com and Investopedia.com.
What Are Courses To Learn About Diamond Top Patterns?
The diamond pattern courses to learn from are "Trading Stock Chart Patterns For Immediate, Explosive Gains" by professional trader Frank Bunn and "Stock and Forex Trading With Chart Pattern Technical Analysis" by certified technical analyst Jyoti Bansal.
