What Is A Double Bottom Pattern In Technical Analysis?
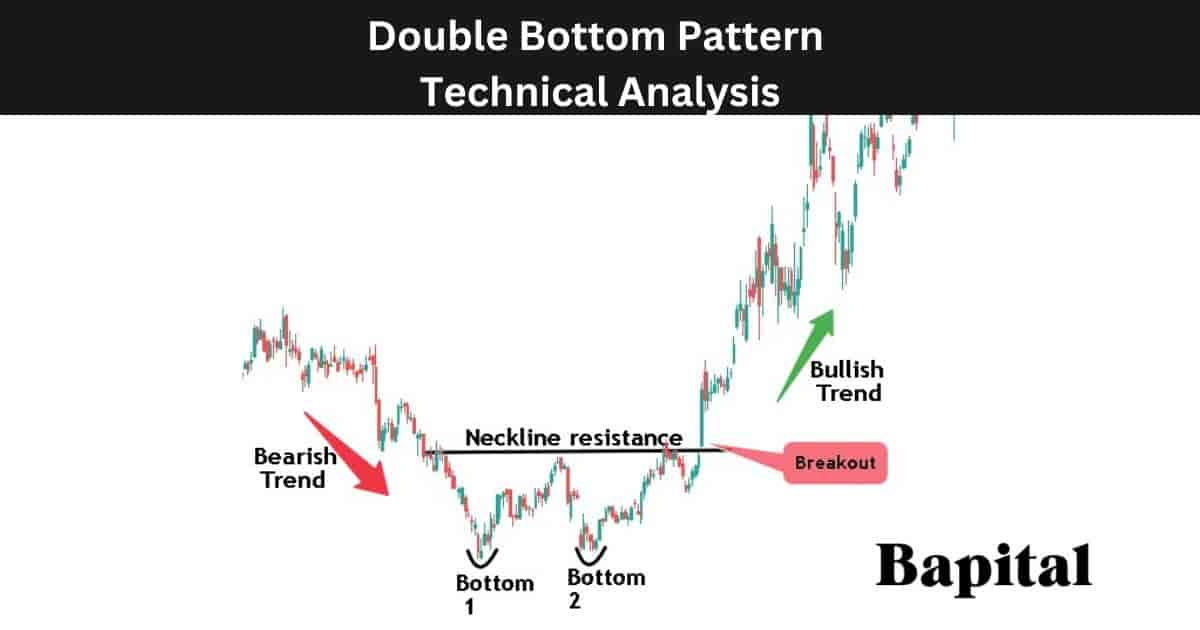
A double bottom pattern is a bullish pattern in technical analysis that signals a bullish reversal of a downtrend. This chart pattern occurs after an extended price decrease in financial markets and consists of two swing low troughs at approximately the same price level, separated by a temporary price bounce. Double bottom patterns are completed when the price increases above the resistance trendline of the price peak that separates the two troughs. A double bottom pattern resembles the letter "W" of the English alphabet.
What Is An Alternative Name For a Double Bottom Pattern?
The double bottom pattern's alternative names are a "double bottom reversal" or "twin bottom pattern".
Is a Double Bottom Pattern Bullish Or Bearish?
A double bottom pattern is a bullish pattern indicating upward market prices, increasing bullish momentum, and declining bearish momentum.
What Does a Double Bottom Pattern Mean In Technical Analysis?
A double bottom pattern means a potential reversal from bearish price action to bullish price action is imminent and market participants are anticipating bull trending markets.
What Is The Importance Of a Double Bottom Pattern In Technical Analysis?
The double bottom pattern is important in technical analysis for indicating bullish price reversals and signaling reduced selling momentum.
What Is The Opposite Of a Double Bottom Pattern?
A double bottom pattern's opposite is the double top pattern which is a bearish pattern and is shaped like an inverse double bottom.
Is a Double Bottom Pattern a Continuation or Reversal Pattern?
A double bottom pattern is a bullish price reversal pattern and not a continuation pattern.
What Are The Components Of a Double Bottom Pattern?
The five double bottom pattern components are a downtrend, left swing low trough, peak, right swing low trough, and a horizontal resistance trend line (neckline).
1. Downward Trend
The double bottom pattern's first component is an downswing trend which sees asset prices decrease marking lower swing highs and lower swing lows.
2. Left Swing Low Trough
The left swing low trough is formed as the market price reaches a support level during the downtrend and a price bounce occurs. This trough represents the end of the first downward price movement and acts as a support area.
3. Peak
The pattern's price peak component forms when prices rise from the left swing low point and then pulls back, forming a peak or high point. This temporary price retracement suggests a brief pause and this level is used to mark the resistance area on the market chart.
4. Right Swing Low Trough
The right swing low trough is formed when prices drops again to a similar level as the first trough, forming the second trough. This is a critical point in the pattern as it indicates that the previous left trough low point could not be penetrated.
5. Horizontal Resistance Trendline (Neckline)
The horizontal resistance trendline (neckline) component is a horizontal resistance line drawn through the peak highs that separates the two swing low troughs. The pattern is considered complete and confirmed when prices break above this neckline, signaling a potential bullish trend reversal.
What Is The Formation Process Of a Double Bottom Pattern?
The double bottom pattern formation process begins firstly with a bearish market price trend with the market price forming lower lows and lower highs as the price falls. The market price reaches a swing low point before a price bounce occurs signaling the formation of the first trough component of the pattern.
Secondly, price rises temporarily to a resistance zone where the price drops which forms the pattern's peak component.
Thirdly, price fallslower to the prior support level where it is met with buying pressure and the price starts to increase again marking the formation of the right-hand side swing trough component of the pattern.
Fourthly, the price moves higher from the support zone and starts to penetrate the resistance area's price breakout level rendering the double bottom pattern formation completed.
What Happens After a Double Bottom Pattern Forms?
After a double bottom pattern forms, a bearish to bullish price reversal occurs with the market price rising above the pattern resistance area and trending higher. This upside breakout is a signal that the previous downtrend is losing momentum, and a bullish reversal is underway.
How Long Does a Double Bottom Take To Form?
Double bottom pattern formation duration ranges from 45 minutes plus on a 1-minute price chart up to 45 years plus on a yearly price chart. To calculate the double bottom pattern formatiomn duration, multiple the timeframe used by 45. For example, a double bottom pattern on a 15 minute price chart takes 675 minutes (15 minutes x 45) to form.
How Often Do Double Bottom Patterns Form?
Double bottoms form 5 - 8 times per year on the daily price charts. Shorter timeframe intraday price charts sees double bottoms form more frequently.
What Type Of Price Charts Do Double Bottoms Form On?
The double bottom pattern forms on candlestick charts, bar charts, open high low close (OHLC) charts, point and figure charts, area charts, and line charts.
What Markets Do Double Bottom Patterns Form In?
Double bottom patterns form in all global markets including stock markets, bond markets, futures markets, exchange traded funds (ETFs), commodity markets, cryptocurrency markets, forex markets, and indices.
What Timeframe Price Charts Do Double Bottom Patterns Form On?
A double bottom pattern forms on all timeframes from intraday tick charts up to yearly chart periods.
How To Identify a Double Bottom Pattern?
Double bottom pattern identification involves looking for market securities in declining bearish trends but showing signs of bearish price exhaustion with price bounces. After the first swing low support price is marked and the asset price moves higher, wait for a price retracement back to the support level and observe the price action. If the price fails to drop below the support area, the pattern's second swing low trough is observed. Watch as the price coils and trends higher. If the price rises through the resistance point, the double top pattern has been identified.
How Do Traders Find Double Bottoms?
Double bottom formations are found by scanning the financial markets with a chart pattern scanner, checking the social media profiles of top traders, expert chartered market technicians (CMT) or expert chartists, browsing the price charts manually, or by checking trading broker software.
How Do Traders Scan For a Double Bottom Pattern?
Double bottom pattern scanning involves using TradingView chart pattern scanner, stockcharts.com chart pattern screener, or browsing the asset price charts manually to spot the pattern in real time.
How Do Traders Draw a Double Bottom Pattern?
The double bottom pattern drawing involves identifying two equal support points and plotting the number 1 and 2 below these two points. Then, draw a horizontal resistance trend line from left to right connecting the pattern's peaks (high price points) together that marks the pattern resistance zone.
How To Trade a Double Bottom Pattern
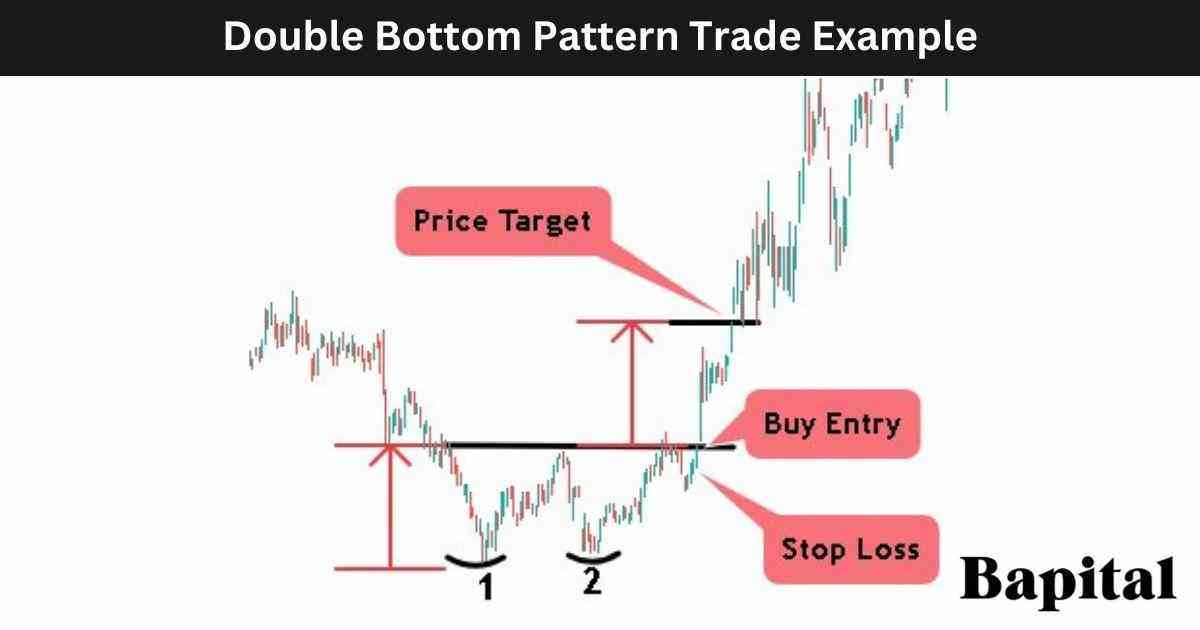
The double bottom pattern trading steps are below.
- Identify the double bottom pattern in a capital market
- Enter a buy trade on a pattern resistance break
- Place a double bottom price target order
- Set a stop loss order below the breakout candlestick low price
- Conduct post trade analysis
1. Identify a Double Bottom Pattern In A Capital Market
The first double bottom pattern trading step is to identify double bottoms in financial markets. Scan the markets using a double bottom screener to find real-time patterns.
2. Enter A Buy Trade On A Pattern Resistance Break
The second double bottom pattern trading step is to enter a buy trade when the market rises above the horizontal resistance level.
What Is The Entry Point Of a Double Bottom Pattern?
The double top pattern entry point is set when the price reaches above the pattern resistance line on rising buyer volume (green bars).
3. Place a Double Bottom Pattern Price Target Order
The third double bottom pattern trading step is to place a price target order by measuring the distance betwene the resistance level and the support level and adding this number to the buy entry price to get the profit target price.
What Is The Price Target Of a Double Bottom Pattern?
A double bottom pattern target is set by calculating the height between the horizontal resistance trendline and the swing low trough level and adding this number to the buy entry point.
For example, if the long entry price of this pattern is $50 and the pattern trough support level is $40, the price target is $60 ($50+$10).
What Is The Price Target Calculation Formula Of a Double Bottom Pattern?
The double bottom pattern price target calculation formula is Double Botton Price Target = Buy Entry Price + Pattern Height.
4. Set A Stop-Loss Order Above Breakdown Candlestick High Price
The fourth double bottom trading step is to set a stop loss order below the breakout candlestick low price.
What Is The Risk Management Of a Double Bottom?
Double bottom pattern risk management is set by placing a stop-loss order below the breakout candlestick price high. A risk of 1% of trading capital is the risk amount when trading double bottoms so traders adjust their postion size accordingly. Traders use stop losses to protect against false signals.
What Is The Risk Reward Ratio When Trading Double Bottoms?
The double bottom pattern risk to reward ratio is 2.8:1 meaning $2.80+ reward for every $1 risk.
What Are The Risks When Trading Double Bottoms?
The double bottom pattern trading risks are the risk of a price gap down causing capital losses, and a risk of market liquidity reducing.
What Are The Common Mistakes When Trading a Double Bottom?
The double bottom pattern common trading mistakes are excessive use of trading leverage and not following trading rules.
5. Conduct Post-Trade Analysis
The fifth double bottom pattern trading step is to conduct post trade analysis after trade position completion. Include trading notes, entry price and exit price information, and annotated charts in the post trade analysis log.
What Is a Double Bottom Pattern Trading Strategy?
A double bottom pattern trading strategy is the U.S. equities trailing stop double bottom strategy. Scan all U.S. equity markets for stocks forming double bottom patterns on the daily timeframe price chart. Place a 10 exponential moving average (EMA) on the market chart. Enter a long trade position when the market security price penetrates the pattern resistance zone on increasing buying volume. Put a trailing stop loss order directly below the 10 exponential moving average. The exit price is when a daily candlestick closes below the 10EMA.
What Type Of Trading Strategies Can Double Bottoms Be Traded In?
The double bottom pattern is traded in scalping strategies, day trading strategies, swing trading strategies, position trading strategies, and investing strategies.
What Are The Trading Rules Of a Double Bottom Pattern?
The double bottom pattern trading rules are listed below.
- Risk 1% of trading capital total
- Avoid trading prior to important economic and political news events
- Conduct market due diligence prior to trade entry
- Avoid high volatility and low liquidity trading markets
- Adapt to new market information dynamically
- Refrain from excessive use of leverage
What Type Of Traders Trade a Double Bottom Pattern?
A double bottom pattern is traded by scalpers, day traders, swing traders, position traders, professional technical analysts, and active investors.
What Type Of Traders Have The Most Success With Trading Double Bottoms?
The double bottom pattern's most successful traders are swing traders, position traders, and longer-term investors as the pattern's win rate and reliability is higher on longer trading time horizons.
Double Bottom Pattern Examples
Double bottom pattern examples are illustrated below.
Double Bottom Stock Market Example
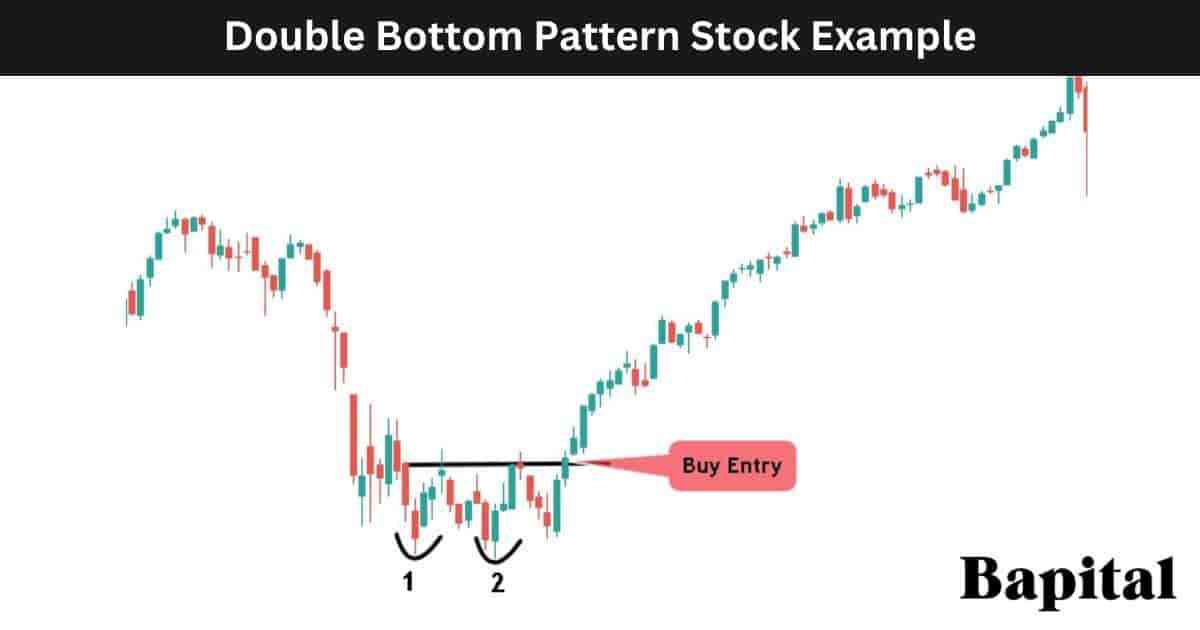
A double bottom pattern stock market example is displayed on the weekly timeframe Apple stock chart (AAPL) above. The stock price drops in a bearish trend before a price consolidation forms two swing low support levels. Apple's stock price starts rising and breaks above the neckline resistance. After the Apple stock price breakout, the price continues trending higher in a bullish direction for multiple months.
Double Bottom Forex Market Example
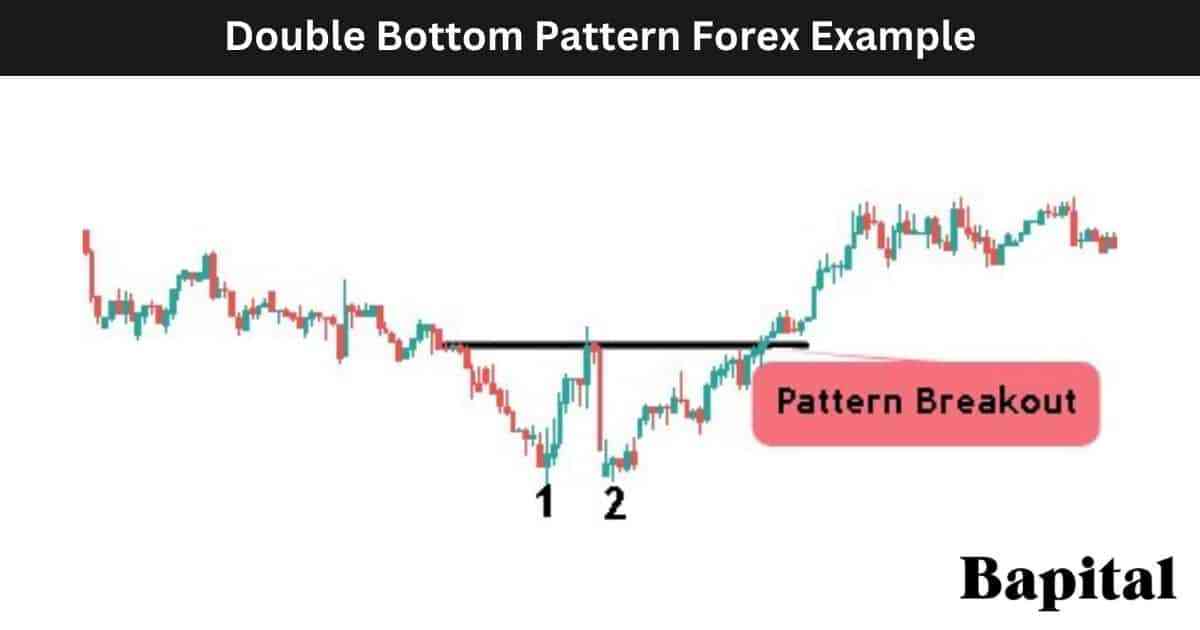
A double bottom pattern forex market example is illustrated on the daily timeframe USD/JPY currency chart above. The forex price drops in a bear trend before the price fluctuates and forms a double bottom. The currency price rises above the pattern neckline resistance zone and continues in a bull trend.
What Are The Benefits Of a Double Bottom Pattern?
The double bottom pattern benefits are listed below.
- Helps identify bullish price reversals: A double bottom pattern helps spot bullish price reversals and assists in findiong buy trade opportunities
- Provides price action logic: The double bottom pattern provides logic to the price action and helps traders understand the market is setting up for a potential reversal
- Easy to understand: The double bottom is easy for novice traders to understand with only 5 components required to identify
- Universal market applicability: The double bottom pattern can be applied in all financial markets from stocks, bonds, ETFs, indexes, forex, crypto, commodities, futures, and options
- Universal timeframe applicability: The double bottom pattern works on all market timeframes
What Are The Limitations Of a Double Bottom Pattern?
The double bottom pattern limitations are listed below.
- False signals: A double bottom pattern generates false signals and fake breakouts which causes trading captital losses
- Does not work in all market conditions: The double bottom pattern does not work in choppy market conditions with the price fluctuating up and down with no clear trend direction
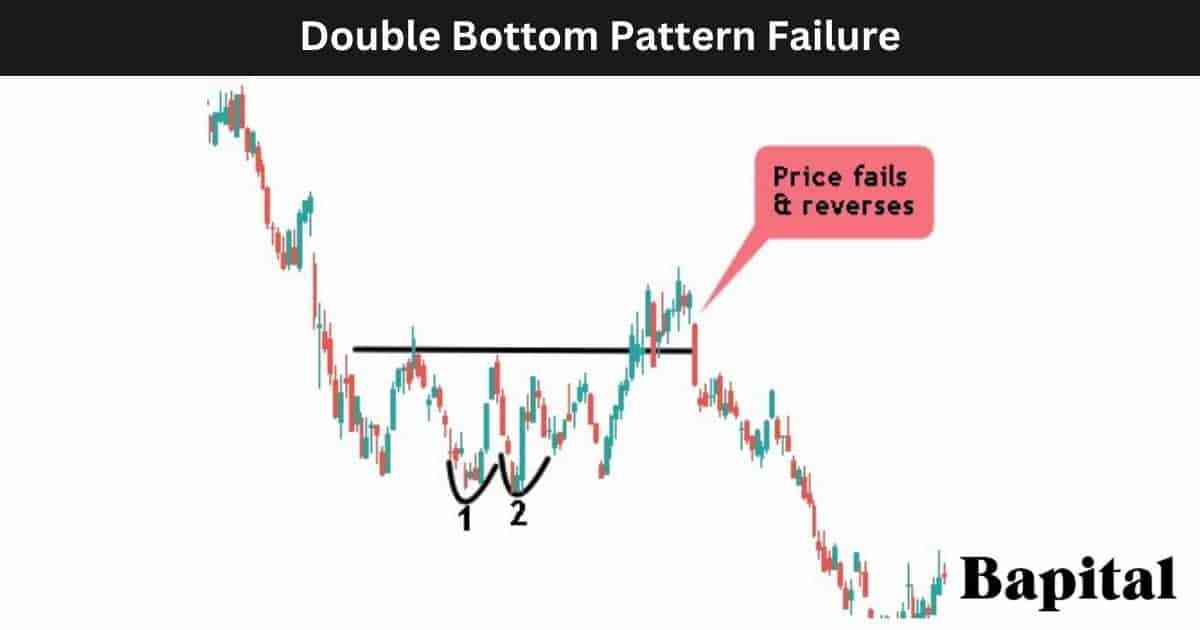
What Is a Double Bottom Pattern Failure?
A double bottom pattern failure, also known as a "failed double bottom reversal", is when a double bottom forms but fails. The double bottom is invalidated and considered a failed double bottom when the market security price breaks out above the price resistance level but quickly results in a major reversal and turns bearish. A failed double bottom pattern is a bearish signal.
What Causes a Double Bottom To Fail?
A double bottom pattern failure is caused by a large influx of sellers, unexpected negative news, and overhead resistance.
- Large seller influx: An influx of large sellers can cause the double bottom pattern to fail and reverse from market price appreciation to market price depreciation
- Unexpected negative news: Unexpected negative or bearish news can cause the double bottom pattern to fail as the negative market news may cause price drops
- Overhead resistance: Significant overhead resistance above the pattern breakout level, such as a key moving averages or a previous price level where sellers are concentrated, it can impede the upward movement following a double bottom pattern and fail
What Technical Indicators Are Used With Double Bottoms?
The double bottom pattern is traded with technical indicators including the volume indicator, volume weighted average price (VWAP), moving average overlay, volume profile, relative strength index (RSI), moving average convergence divergence (MACD), bollinger bands, keltner channels, average true range (ATR), average daily range (ADR), and the chaikin oscillator.
What Is The Most Popular Technical Indicator Used With Double Bottoms?
The double bottom pattern's most popular technical analysis indicator used is the volume indicator which acts as a confirmation signal after a market price breakout occurs with rising buyer volume indicating a higher probability of a winning trade.
What Is The Psychology Behind a Double Bottom Pattern?
The double bottom pattern reflects underlying shifts in investor psychology. Initially, as market prices decline, sentiment tends to turn negative, driving the asset's value down to a notable support level. At this point, many investors may feel disheartened or fearful, leading to heightened selling pressure. However, as the price reaches this support level and forms the first bottom, some investors begin to perceive the asset as undervalued. This shift in perception leads to a decrease in selling pressure and a potential price rebound.
The subsequent price rally forms the neckline of the double bottom pattern, signaling a possible reversal of the previous downtrend. The pattern's completion occurs when the price falls again to retest the support level, forming the second bottom, which is often accompanied by diminishing selling pressure and increasing buying interest. Ultimately, the double bottom pattern reflects a market sentiment transition from pessimism to optimism, as investors regain confidence in the asset's prospects, thereby potentially initiating a new market uptrend.
What Are Statistics Of the Double Bottom Pattern?
The double bottom pattern statistics are below.
How Accurate Is a Double Bottom Pattern?
The double bottom pattern accuracy rate is 34% from our data of 1,308 of these chart pattern formations.
Is a Double Bottom Pattern Reliable?
Yes, a double bottom pattern is reliable provided the trading rules are followed. Higher timeframe weekly timeframe and above charts are more reliable to intradray timeframe double bottoms.
What Market Conditions Is a Double Bottom Most Reliable?
A double bottom pattern is most reliable in bullish trend markets with market prices increasing.
What Market Conditions Is a Double Bottom The Least Reliable?
A double bottom pattern is least reliable in volatile markets with market prices fluctuating in no clear direction.
Is a Double Bottom Pattern Profitable?
Yes, a double bottom pattern is profitable as the average success rate is 34% and the average return to risk ratio is 2.8 to 1. This means for every 100 trades, a trader wins 34 trades making 2.8 units (95.2 units total) and loses 66 trades losing 1 unit (66 units total). Therefore, over 100 trades, a trader should hypothetically net 29.2 units (95.2 units - 66 units). Be aware that past performance is not indicative of future trading results.
What Are Alternatives To a Double Bottom Pattern?
The double bottom pattern alternatives are listed below.
What Are The Key Facts Of a Double Bottom Pattern?
The double bottom pattern key facts are below.
