What Is a Pennant Pattern In Technical Analysis?
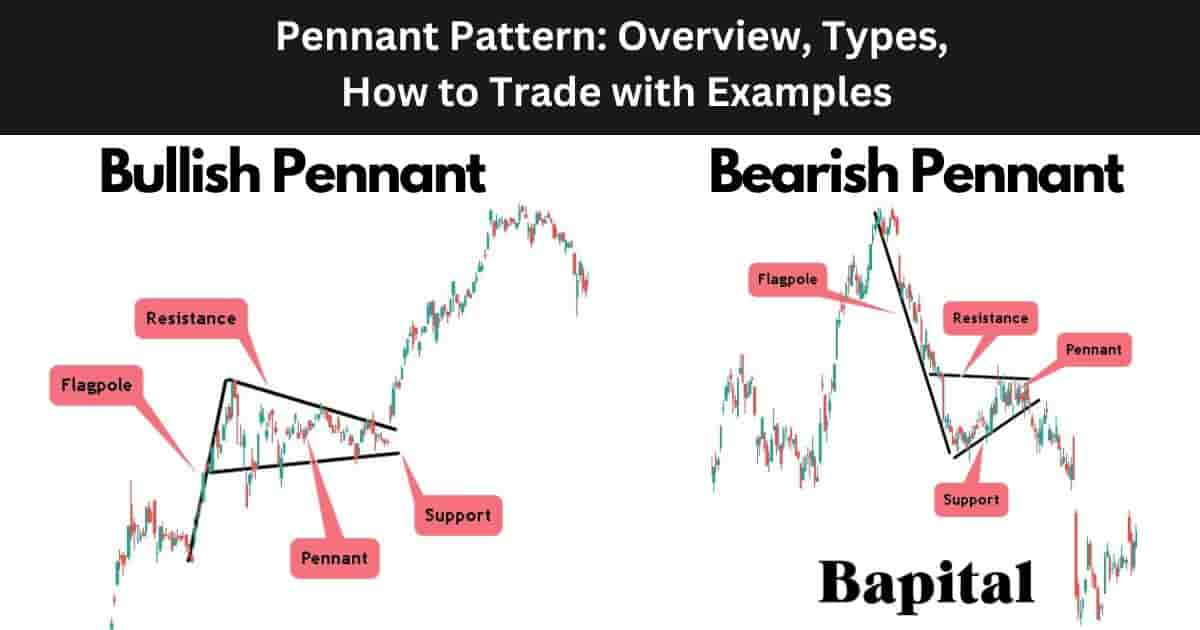
A pennant pattern is a pattern in technical analysis that forms when there is a large bullish or bearish trend and a price consolidation. The pennant pattern signals a continuation of an underlying price trend after a pattern breakout. The pennant pattern consists of a flagpole and converging trendlines with the converging trendlines indicating a temporary pause before the resumption of the previous trend.
What Does a Pennant Pattern In Technical Analysis Mean?
A pennant pattern means that the underlying trend direction is expected to continue after the pattern formation is complete and price moves out of the pattern range.
What Is The Importance Of a Pennant Pattern In Technical Analysis?
A pennant pattern is important in technical analysis as it enables traders to enter market trends from a low risk entry point and it offers price action understanding for traders.
What Technical Indicators Are Used With a Pennant Pattern?
Pennant patterns are used with technical indicators including the volume indicator, moving average overlay indicator, volume weighted average price (VWAP), anchored vwap indicator, bollinger bands, keltner channels, average true range indicator, relative strength index (RSI), and the moving average convergence divergence indicator (MACD).
What Are The Components Of a Pennant Pattern?
The 4 pennant pattern components are listed below.
- Flagpole: The pennant pattern flagpole represents a strong and sharp price movement. This initial move is either upward (bullish pennant) or downward (bearish pennant) and represents a significant and rapid change in market sentiment
- Consolidation Phase: The pennant pattern consolidation phase is the period in which the market security enters a period of consolidation or sideways movement. This phase is characterized by decreasing price volatility, and the formation of converging trendlines shaped like a symmetrical triangle
- Converging Trendlines: The pennant pattern's converging trendlines component represent the pattern's upper resistance level and the pattern's lower support level
- Breakout: The pennant pattern breakout is when the price exits the consolidation phase on increased volume. The breakout direction is in the same direction as the initial flagpole, signaling a potential continuation of the preceding trend
What Are The Types Of Pennant Patterns?
The 2 pennant pattern types are the bullish pennant pattern which is a bullish continuation pattern and a bearish pennant pattern which is a bearish continuation pattern.
1. Bullish Pennant Pattern
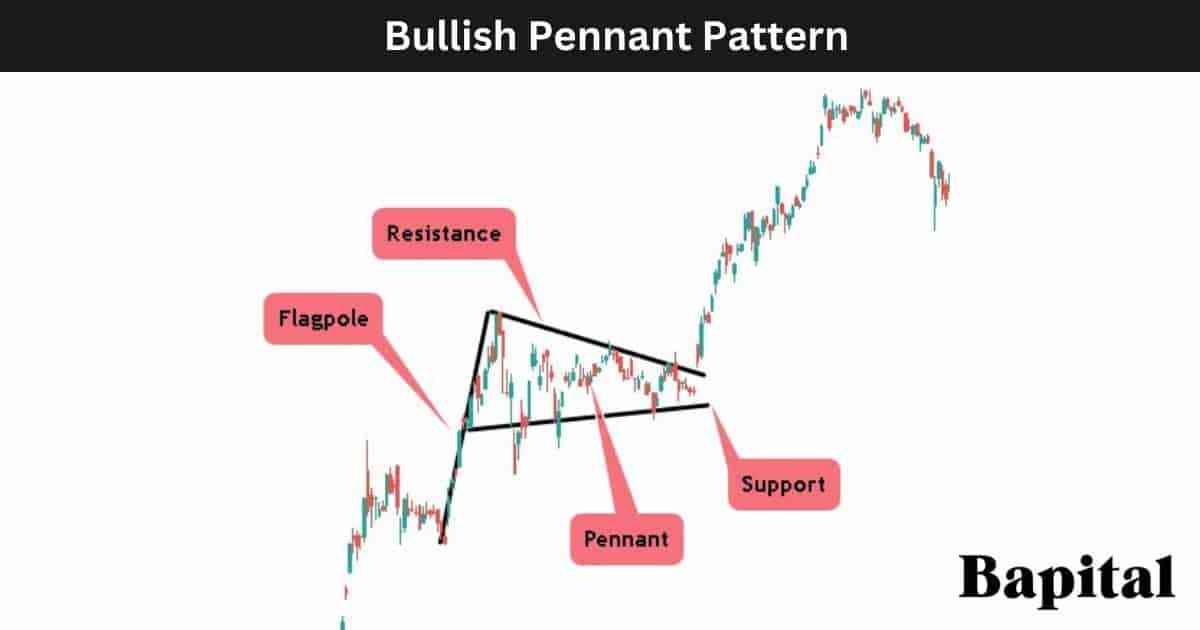
A bullish pennant pattern is a pattern in technical analysis that signals a bullish trend continuation after a brief market price consolidation during an already established price uptrend. A bullish pennant is a bullish continuation pattern and not a reversal pattern. A bullish pennant's alternative name is a "rising pennant pattern".
2. Bearish Pennant Pattern
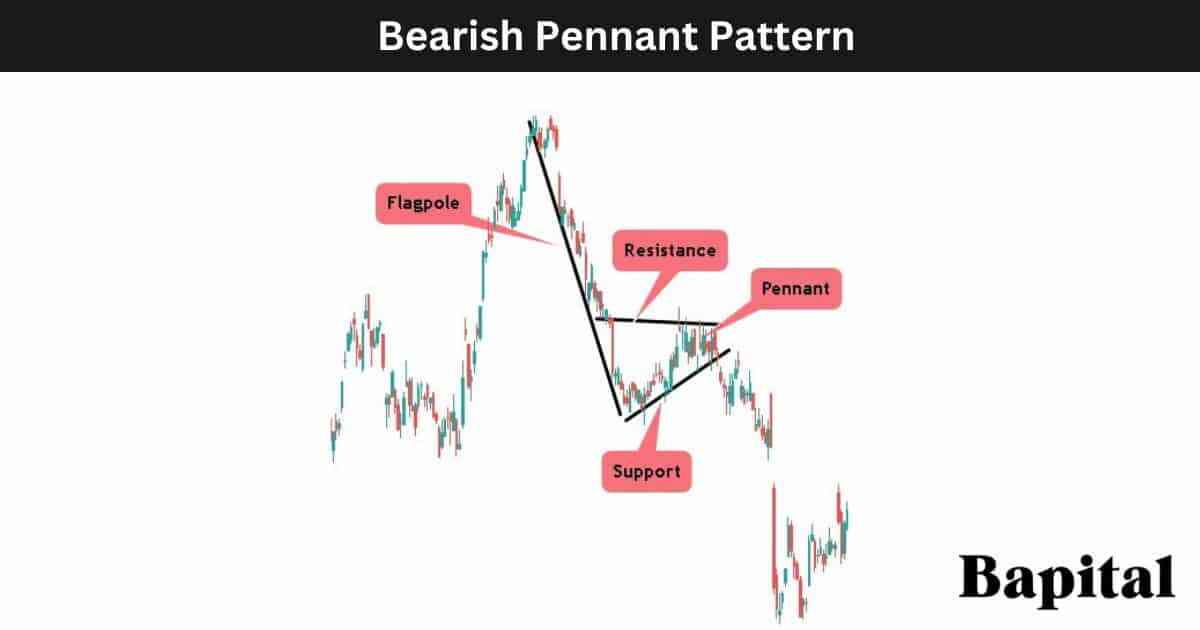
A bearish pennant pattern is a pattern in technical analysis that signals a bearish trend continuation after a brief market price consolidation during an already established price downtrend. A bearish pennant is a bearish continuation pattern and not a reversal pattern. A bearish pennant's alternative name is a "descending pennant pattern".
What Is The Formation Process Of a Pennant Pattern?
The pennant pattern formation process begins with the formation of the flag pole which is formed by a sharp market price increase or sharp market price decrease.
Secondly, the pennant pattern formation sees the formation of a price rangebound period with price fluctuating between converging support and resistance lines.
Thirdly in the pennant pattern formation process is the market price moving out of the consolidation area in a price breakout or price breakdown.
What Happens After a Pennant Pattern Forms?
After a pennant pattern forms, the market price breaks out from the pattern price consolidation range and moves in the same trend direction as the underlying trend.
What Causes a Pennant Pattern To Form?
The pennant pattern is caused by a pause in the prevailing trend, often triggered by temporary market indecision or profit-taking. This temporary price pause sees the pattern form within the price range.
How Long Does a Pennant Pattern Take To Form?
A pennant pattern formation duration is a minimum of 30 days on a daily timeframe price chart. To calculate the pennant pattern formation duration, multiple the timeframe used by 30. For example a pennant pattern on a 20-minute timeframe price chart would take a minimum of 600 minutes (20 minutes x 30) to form.
How Often Does a Pennant Pattern Take To Form?
Pennant patterns occur 3 to 5 times per year on a daily price chart depending on market environment. A shorter timeframe chart sees a pennant form more frequently.
What Type Of Price Charts Does a Pennant Pattern Form On?
A pennant pattern forms on bar charts, candlestick charts, open high low close (OHLC) charts, line charts, area charts, and point and figure charts.
What Markets Does a Pennant Pattern Form In?
A pennant pattern forms in all global financial markets including stock markets, forex markets, bond markets, cryptocurrency markets, indices, futures markets, and options markets.
What Timeframe Price Charts Does a Pennant Pattern Form On?
The pennant pattern forms on price chart timeframes ranging from short-term tick charts to longer-term yearly price charts.
How Do Traders Identify a Pennant Pattern?
A pennant pattern is identified by its shape during a price uptrend or price downtrend in a capital market. A flagpole is observed when the price steeply rises or steeply drops. The converging trendline component is identifed when the market price pauses during a trending market enviroment and forms lower swing high points and higher swing low points. The pattern breakout is identified by watching for an asset price breakout from the pattern's rangebound area with tightening price action.
How Do Traders Find a Pennant Pattern?
Pennant pattern formations are found by scanning the financial markets with a charting screener, checking the online profiles of top traders or expert chartered market technicians (CMT), browsing the market charts manually, or by checking trading broker software.
How Do Traders Scan For a Pennant Pattern?
Traders scan for pennant chart patterns by using the Finviz.com chart pattern scanner, using a charting software pattern scanner feature, or by creating a custom pattern script to scan for pennants.
How Do Traders Draw a Pennant Pattern?
A bullish pennant pattern drawing begins with the flagpole component which is drawn from bottom to top and it marks the bull trend. Secondly, a declining resistance trendline is drawn from left to right which connects the lower swing high points together. Finally, a rising support trendline is drawn which connects the higher swing low points together.
A bearish pennant pattern drawing begins with the flagpole component which is drawn from top to bottom and it marks the bear trend. Secondly, a downward sloping resistance line is drawn from left to right which connects the lower swing high peaks together. Thirdly, an upward sloping support line is drawn from left to right which connects the swing low troughs together.
How To Trade a Pennant Pattern
The 6 pennant pattern trading steps are below.
- Identify the pennant pattern on a price chart
- Enter buy trade on bullish pennant breakout or short trade on bearish pennant breakdown
- Set a price target order for the trade positon
- Place a stop-loss order at the bullish pennant support line or the bearish pennant resistance line
- Analyze the trading volume during the market price pattern breakout
- Conduct post pennant trade analysis
1. Identify The Pennant Pattern On a Price Chart
The pennant pattern first trading step is to identify the pattern on a market chart. Use a pennant scanner or browse the market price charts manually to find the patterns in real time.
2. Enter Buy Trade On Bullish Pennant Breakout Or Short Trade On Bearish Pennant Breakdown
The second pennant pattern trading step is to enter a buy trade or short trade on a breakout from the pattern consolidation area.
What Is The Entry Point On a Bullish Pennant Pattern?
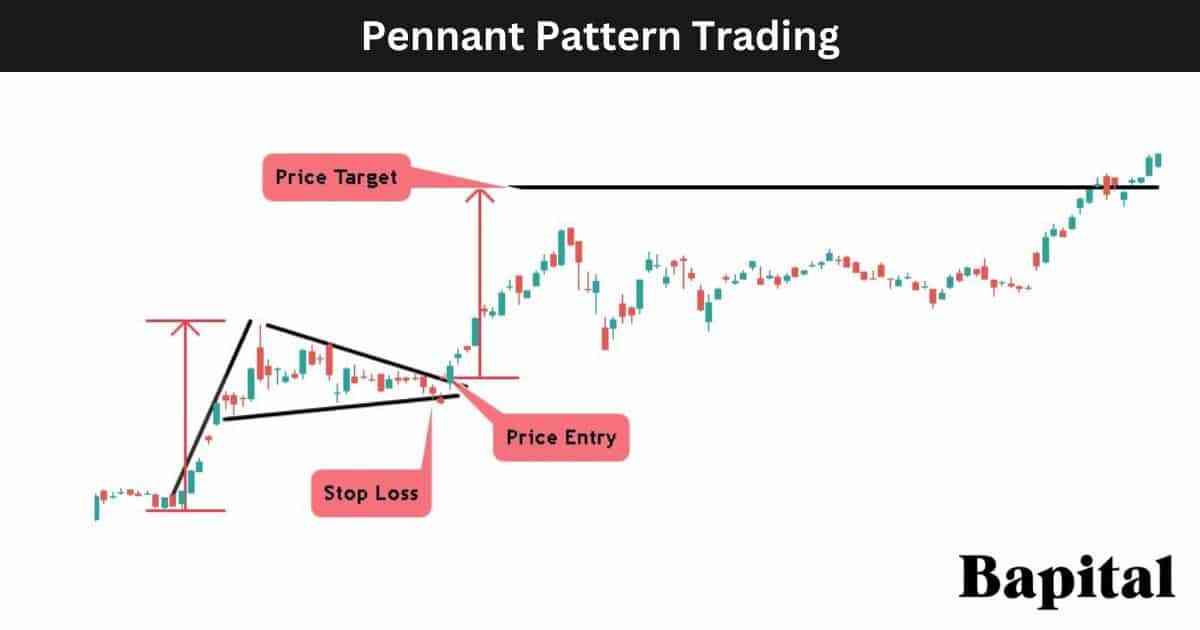
The bullish pennant pattern entry point is when the market price penetrates the pattern resistance area on rising buyer volume.
What Is The Entry Point On a Bearish Pennant Pattern?
The bearish pennant pattern entry point is when the market price drops below the pattern support area on rising seller volume.
3. Set A Price Target Order For The Trade Position
The third pennant pattern trading step is to set a profit target level for the trading position.
What Is The Price Target Of a Bullish Pennant?
A bullish pennant pattern price target is set by measuring the height of the flagpole and adding this number to the long trade entry price to generate the exit price.
What Is The Bullish Pennant Pattern Price Target Calculation Formula?
The bullish pennant pattern price target calculation formula is Bullish Pennant Price Target = Flagpole Height + Buy Entry Price.
What Is The Price Target Of a Bearish Pennant?
A bearish pennant pattern price target is set by measuring the height of the flagpole and subtracing this number from the short trade entry price to generate the trade exit point.
What Is The Bearish Pennant Pattern Price Target Calculation Formula?
The bearish pennant pattern price target calculation formula is Bearish Pennant Price Target = Short Entry Price - Flagpole Height.
4. Place Stop-Loss Order At Bullish Pennant Support Line Or Bearish Pennant Resistance Line
The fourth pennant pattern trading step is to place a stop-loss order to manage risk and downside protection.
What Is The Risk Management Of a Bullish Pennant?
The bullish pennant pattern risk management is set by placing a stop-loss order below the pattern's uptrending support line. Use a stop market sell order or stop limit sell order when managing bullish pennant pattern risk.
What Is The Risk Management Of a Bearish Pennant?
The bearish pennant pattern risk management is set by placing a stop-loss order above the pattern's downtrending resistance line. Use a stop market buy order or stop limit buy order when managing bearish pennant pattern risk.
What Is The Risk/Reward Ratio Of a Pennant Pattern?
The pennant pattern's risk to reward ratio is 2.5:1, meaning a reward of $2.50+ for every $1 risked.
What Are The Risks Of Trading a Pennant Pattern?
The pennant pattern trading risks are a risk of the market price gapping up or down against the trading position direction, risk of increased market volatility causing high profit and loss fluctuations, and unexpected market news causing large trading losses.
What Are Common Mistakes When Trading a Pennant Chart Pattern?
The pennant pattern common trading mistakes are trading a leveraged position with high risk, lack of patience, no trading rule adherence, no trading discipline, and not understading the exit price and risk tolerance prior to trade entry.
5. Analyze Trading Volume During Market Price Pattern Breakout
The fifth pennant pattern trading step is to analyze the trading volume at the pattern price breakout level. Monitor for increased buying volume on a bullish pennant breakout and increased selling volume on a bearish pennant breakdown.
6. Conduct Post Pennant Trade Analysis
The sixth pennant pattern trading step is to conduct post-trade analysis. The post trade analysis should include entry and exit point information, an overall market condition summary, trade position size, profit/loss amount, trade pros and cons, annotated market charts, trading psychology during the trade, and rule adherence information.
What Are The Rules Of Trading a Pennant Pattern?
The pennant pattern trading rules are below.
- Risk 1% of trading capital per trade total
- Confirm the pattern's validity through volume analysis
- Be mindful of upcoming market news and events
- Monitor for false signals by using the volume indicator as price breaks out or breaks down
- Continuously reassess the trading strategy based on evolving market dynamics
- Avoid pennant trading during extremely volatile markets
What Is a Pennant Pattern Trading Strategy?
A pennant pattern trading stategy is the bullish pennant trailing stop breakout strategy. Scan U.S. equities for a bullish pennant formation. Place a 10 exponential moving averge on the daily price chart. Wait for a bullish pattern breakout. Enter a buy positions as the price penetrates the resistance point. Watch for an increase in buying volume as the price breakout point. Put a trailing stop-loss order on the 10EMA price and trail this stop loss as the price continues rising higher. When the market price candlestick closes below the moving average, close the trade position.
What Type Of Trading Strategies Use Pennant Patterns?
A pennant pattern is traded in scalping strategies, day trading strategies, swing trading strategies, position trading strategies, and investment strategies.
What Type Of Traders Trade a Pennant Pattern?
Pennant patterns are traded by scalpers, day traders, swing traders, and position traders.
What Are Examples Of a Pennant Pattern?
Pennant pattern historical examples are illustrated below.
Bullish Pennant Pattern Stock Market Example
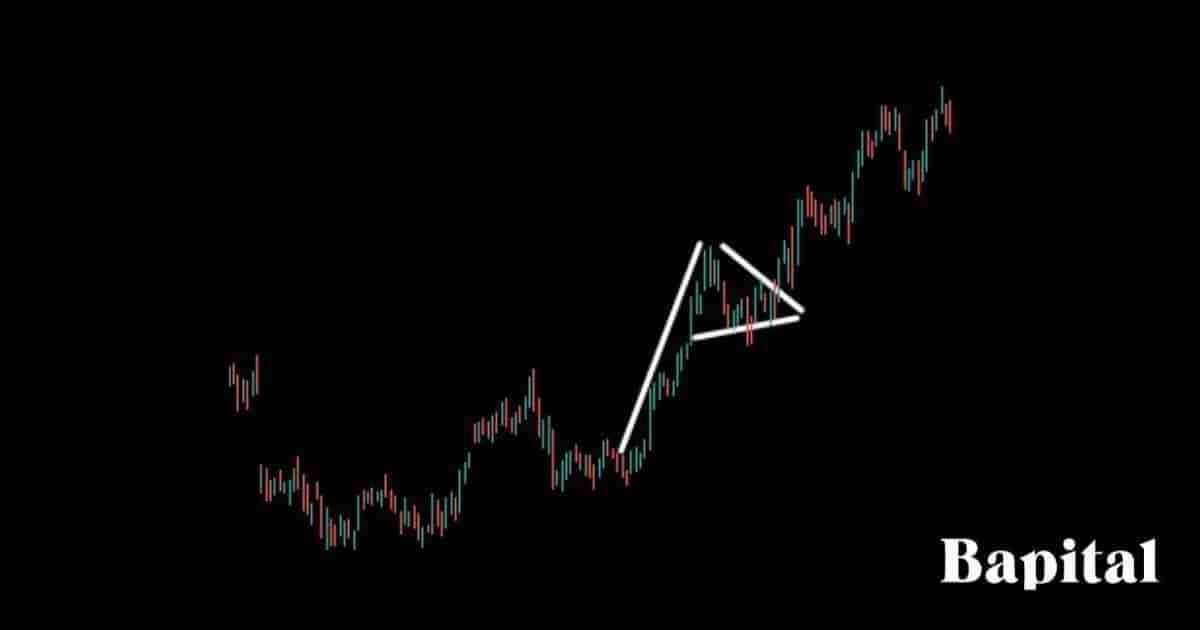
A bullish pennant pattern example is illustrated on the daily Netflix stock price chart above. The Netflix market price rises in a bullish trend forming the flagpole. The price consolidates and fluctuates between resistance and support levels. The market security price then breaks out and trends higher leading to pattern completion.
Bearish Pennant Pattern Forex Market Example
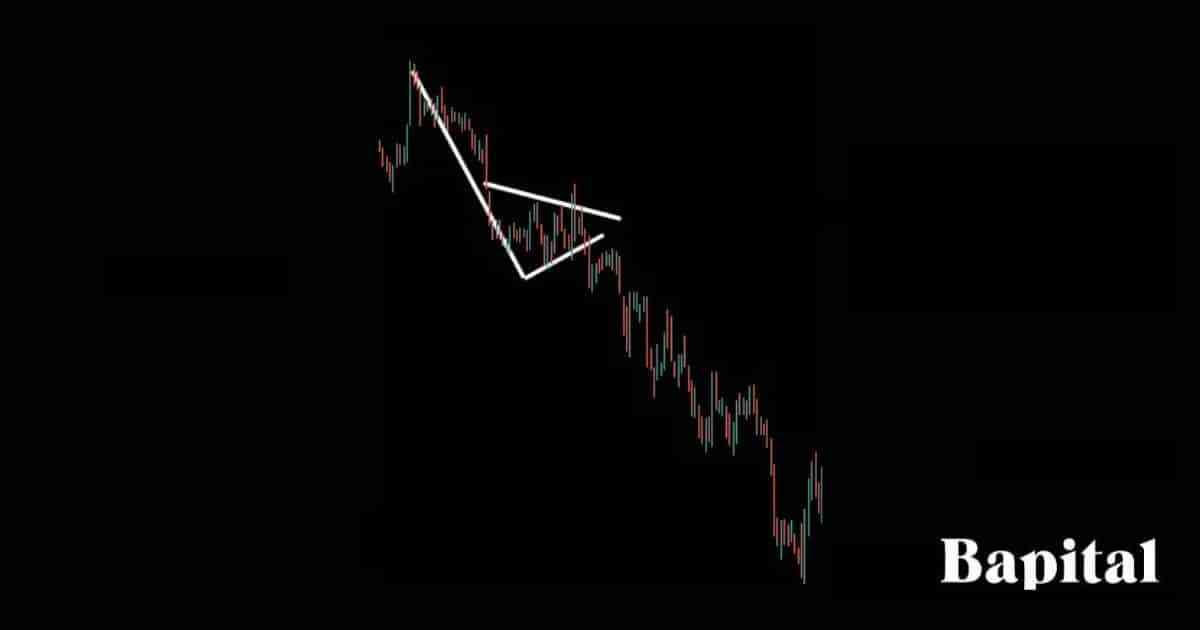
A bearish pennant pattern forex example is illustrated on the weekly NZD/USD forex chart above. The NZD/USD price declines in a bearish trend forming the flagpole. The currency price consolidates and forms the converging support and resistance lines of the pattern. The asset price then breaks down and trends downwards leading to pattern completion.
What Are The Benefits Of a Pennant Pattern?
The pennant pattern benefits are listed below.
- Helps traders catch large price trends: Pennants assist traders with capturing large price movements from a low risk entry point
- Favorable reward to risk ratio: The pennant pattern offers a reward to risk ratio of $2.50+ reward for every $1 risked
- Beginner friendly: Pennants are beginner friendly and easy for novice traders to identify, learn, and trade
- Applicable in all markets: Pennant patterns work in all global markets including futures, stocks, ETFs, options, forex, bonds, cryptocurrencies, and commodities. These patterns are not limited to any one market
What Are The Limitations Of a Pennant Pattern?
The pennant pattern limitations are listed below.
- Hard to trade in illiquid markets: Pennant patterns are difficult to trade in illiquid markets where the price action is choppy and full of market noise
- False breakouts: The pennant pattern can create many failed breakout signals and false breakouts so traders need good risk management rules in place
What Is a Pennant Pattern Failure?
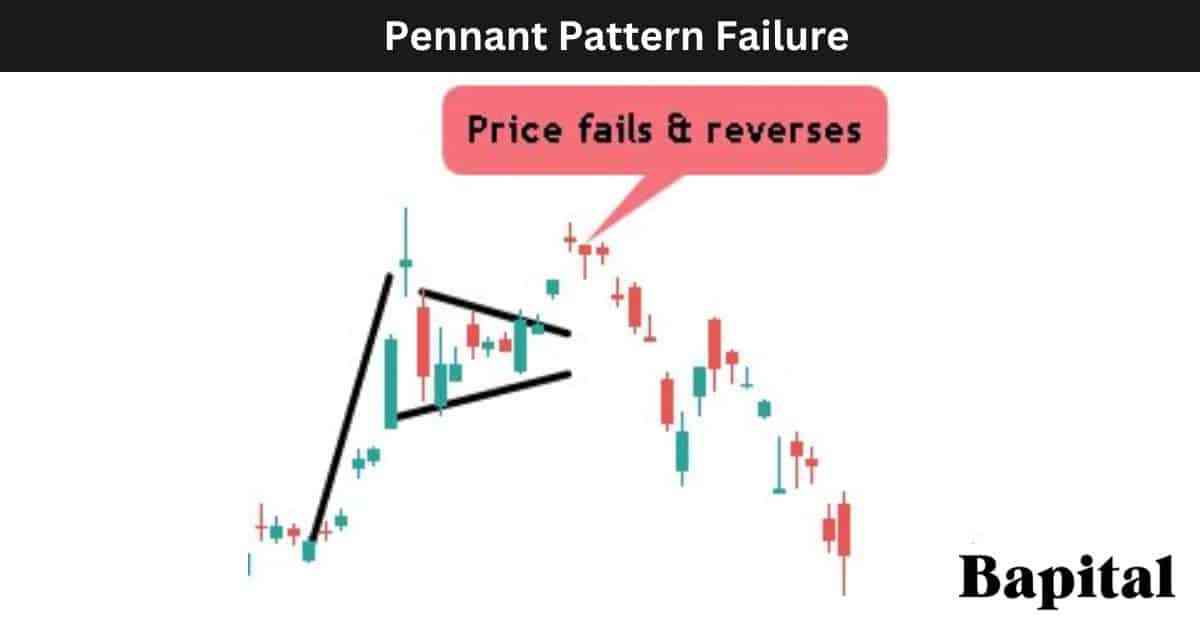
A pennant pattern failure, also known as a "failed pennant", is when a pennant pattern forms, the price breaks out of the pattern but fails to continue in the price breakout direction. The pennant pattern is invalidated and fails when the asset price reverses after a pattern breakout and trends in the opposite direction of the breakout.
What Causes a Pennant Pattern To Fail?
The pennant pattern failure causes are listed below.
- Low Volume: Lower trading volume or during the pattern breakout can weaken the reliability of the pattern. Volume is often considered a confirming factor for price movements, and low volume can indicate a lack of market conviction and result in a price reversal in the opposite direction
- Changing Market Sentiment: A significant market sentiment shift can override the signals provided by technical patterns. For example, a sudden investor sentiment change due to macroeconomic factors can lead to a failed pennant pattern
- Unexpected Market News: Sudden economic data releases, geopolitical events, or other unforeseen factors can lead to unpredictable price fluctuations that invalidate the pennant pattern
What Is The Psychology Behind a Pennant Pattern?
The bullish pennant psychology involves traders being optimistic as the market price rises in an upswing before a price retracement occurs meaning traders are starting to exercise caution by taking profits. As the price coils and breaks above the resistance level, traders renew optimism and hope of further price increases.
The bearish pennant pattern psychology involves trader pessimism as the price falls lower in a downswing before a price bounce occurs meaning traders are cautiously optimistic. As rangebound price action occurs, traders are confused as to the next price direction. As the security price falls below the pattern support level, traders renew their fear and pessimism and start to panic as the price continues falling.
What Are The Statistics Of a Pennant Pattern?
The pennant pattern statistics are below.
How Accurate Is a Pennant Pattern?
A pennant pattern's accuracy is 47% from our historical backtesting data of 2,048 of these chart pattern formations.
Is a Pennant Pattern Reliable?
Yes, a pennant pattern is reliable with a solid win percentage and risk to reward ratio making the pattern a reliable one to trade. Higher timeframe pennant patterns are more reliable than shorter term pennant patterns.
What Market Conditions Is a Pennant Pattern Most Reliable?
A pennant pattern's most reliable market conditions is in bullish and bearish trending markets with clear price trend movement and low volatility.
What Market Conditions Is a Pennant Pattern The Least Reliable?
A pennant pattern's least reliable market conditions is choppy, sideways price action with no clear trend and high volatility.
Is a Pennant Pattern Profitable?
Yes, a pennant pattern is profitable as the average success rate is 47% and the average return to risk ratio is 2.5 to 1. This means for every 100 trades, a trader wins 47 trades making 2.5 units (117.5 units total) and loses 53 trades losing 1 unit (53 units total). Therefore, over 100 trades, a trader should hypothetically net 64.5 units (117.5 units - 53 units). Be aware that past performance is not indicative of future trade results.
What Are Alternatives To a Pennant Pattern?
The pennant pattern alternatives are below.
- Bullish flag pattern
- Bearish flag pattern
- Bullish cup and handle pattern
- Bullish ascending triangle pattern
- Bearish descending triangle pattern
- Symmetrical triangle chart pattern
- Bullish inverse head and shoulders pattern
- Bearish head and shoulders pattern
- Gap chart pattern
- Rectangles
What Is The Opposite Of a Pennant Pattern?
A pennant pattern's opposite is the flag pattern which includes the bullish flag and bearish flag.
What Is The Difference Between A Pennant And A Flag Pattern?
The pennant pattern's difference with a flag pattern is in the pattern's shape with a pennant pattern having declining and rising support and resistance lines during the consolidation phase while a flag pattern having parallel support and resistance levels during the consolidation phase.
What Are The Key Facts Of a Pennant Pattern?
The pennant pattern key facts are below.
