What Is a Rectangle Pattern In Technical Analysis?
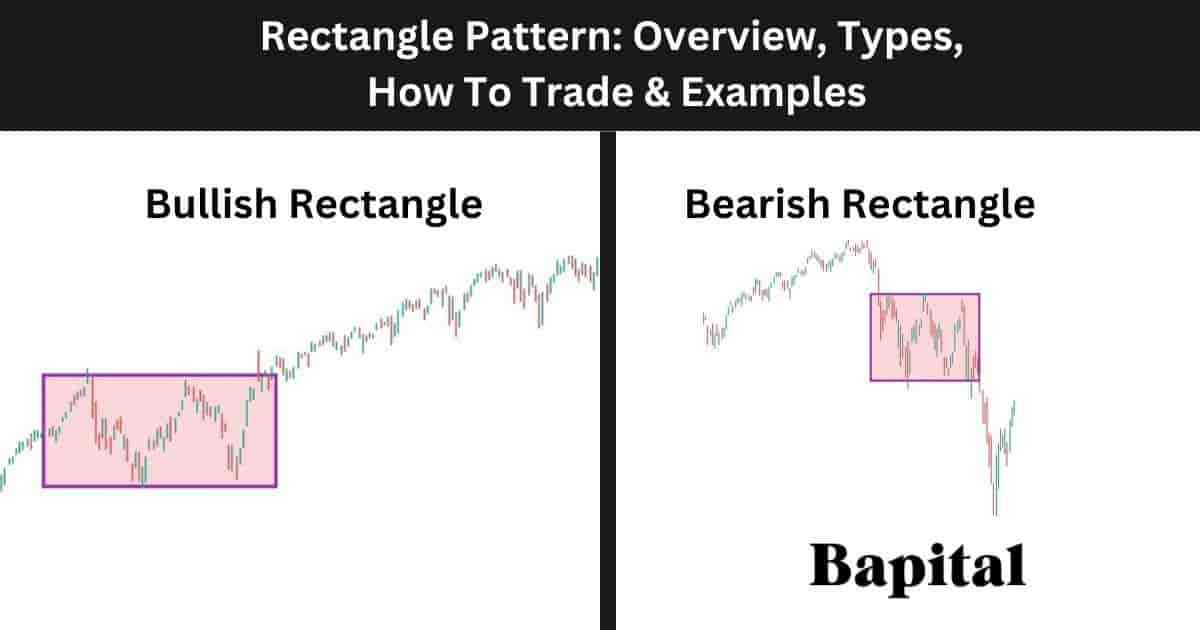
A rectangle pattern is a pattern in technical analysis that forms when the market price consolidates in a price range between a parallel horizontal resistance level and a horizontal support level. The rectangle pattern is characterized by relatively equal swing highs and swing lows, resulting in the formation of a rectangular shape on the price chart. Traders often identify rectangle patterns as consolidation phases, where the market temporarily pauses before deciding on its next significant move. The rectangle pattern's support and resistance levels serve as key reference points for traders, as a price breakout above the pattern's upper boundary or below the pattern's lower boundary signals potential trend reversals or trend continuations.
What Are The Types Of Rectangle Patterns In Technical Analysis?
The two rectangle pattern types are the bullish rectangle and the bearish rectangle.
1. Bullish Rectangle Pattern
A bullish rectangle pattern is a pattern that forms when market prices consolidate between a horizontal support trendline and a horizontal resistance trendline before the price breaks out above the rectangle pattern's resistance level and the price continues rising higher in an upward direction.
2. Bearish Rectangle Pattern
A bearish rectangle pattern is a pattern that forms when market prices consolidate between a horizontal support line and a horizontal resistance line before the market price breaks down below the rectangle pattern's support level and the price continues moving lower in a downward direction.
What Is The Importance Of a Rectangle Pattern In Technical Analysis?
The rectangle pattern is important as it enables traders to make informed trading decisions based on whether a market is in a consolidating period or a trending period.
Is a Rectangle Pattern Bullish or Bearish?
A rectangle pattern can be either bullish or bearish depending on the breakout direction with a bullish rectangle pattern being bullish with prices trending higher and a bearish rectangle pattern being bearish with prices trending lower.
Is a Rectangle Pattern a Continuation or Reversal Pattern?
A rectangle pattern can serve as either a continuation pattern or reversal pattern depending on the breakout direction. A rectangle continuation pattern is when a rectangle forms within an underlying trend and continues to trend in the same trend direction post pattern breakout. A rectangle reversal pattern is when a rectangle pattern forms within an underlying trend and breaks out of the pattern in the opposite direction to the prevailing trend.
What Are The Components Of a Rectangle Pattern?
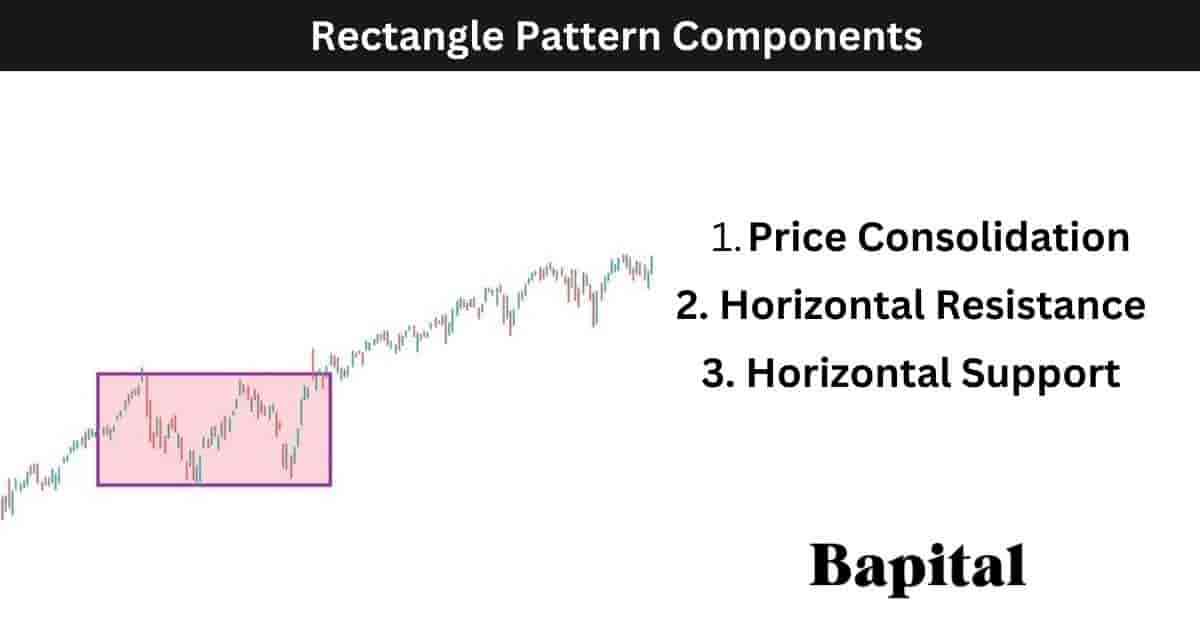
The rectangle pattern components are two parallel horizontal support and resistance trendlines and a price consolidation component with price fluctuating between the two price levels.
What Are The Components Of a Bullish Rectangle Pattern?
The bullish rectangle pattern components are two parallel horizontal resistance and support trend lines, a price consolidation period, and a bullish price breakout component.
What Are The Components Of A Bearish Rectangle Pattern?
The bearish rectangle pattern components are two parallel straight resistance and support lines, price consolidation area, and a bearish price breakdown component.
What Is The Formation Process Of a Rectangle Pattern?
The formation process of a rectangle pattern involves firstly the market price fluctuating between swing high points and swing low points. Secondly, as two or more swing high peaks and two swing low troughs develop, a clear horizontal resistance price level and horizontal support price level forms and the pattern formation is complete.
What Happens After a Rectangle Forms?
After a rectangle forms, the asset price moves out of the narrow trading range either upward in a bullish breakout direction or downward in a bear trend direction.
What Causes a Rectangle Pattern To Form?
A rectangle pattern is caused by a price consolidation phase and market indecision whereby neither buyers nor sellers are able to establish control with the price trading in a sideways range with no clear bullish or bearish direction.
How Long Does a Rectangle Pattern Take To Form?
A rectangle pattern takes a minimum of 30 days to form on a daily timeframe price chart. To calculate the rectangle pattern formation duration, multiple the timeframe used by 30. For example a rectangle pattern on a 20-minute price chart would take a minimum of 600 minutes (20 minutes x 30) to form.
How Often Do Rectangle Patterns Form?
Rectangle patterns form 12 to 16 times per year on a daily timeframe price chart depending on market conditions. Shorter timeframe price charts see the pattern occur more often.
What Type Of Price Charts Do Rectangle Patterns Form On?
Rectangle patterns form on price charts including candlestick charts, bar charts, open high low close (OHLC) charts, and point and figure charts.
What Markets Do Rectangle Patterns Form In?
Rectangle patterns form in all markets including capital markets, money markets, derivatives markets, foreign exchange markets, commodity markets, cryptocurrency markets, interbank markets, over the counter (OTC) markets, equity markets, and fixed-income markets. These markets cover stocks, options, futures, ETFs, forex, cryptocurrencies, commodities, and bonds.
What Timeframes Do Rectangle Patterns Form On?
Rectangle patterns form on all timeframes from short term 1-second timeframe charts to longer-term yearly timeframe price charts.
What Is The Most Popular Timeframe To Trade Rectangle Patterns?
The most popular timeframe to trade a rectangle pattern is the daily price chart as this timeframe is the most reliable with a 42% win probability for the daily timeframe.
What Is The Least Popular Timeframe To Trade Rectangle Patterns?
The least popular timeframe to trade a rectangle pattern is the 1-second price chart as it generates many false signals on this timeframe.
How To Identify a Rectangle Pattern
To identify a rectangle pattern, traders look for a series of highs and lows that form nearly horizontal trendlines, creating the rectangular shape. The consolidation phase length can vary, ranging from short-term to longer-term patterns but a minimum of two swing high and low points are needed for identification.
Traders should pay attention to the uniformity of the highs and lows, indicating buying and selling pressure balance. Volume analysis is also crucial with decreasing trading volumes identified during the consolidation period.
Rectangle pattern confirmation is identified when the price breaks out decisively above the resistance level or below the support level. Identifying this breakout or breakdown, along with increased trading volume, adds confidence to the pattern recognition.
How Do Traders Find Rectangle Patterns?
Rectangle pattern formations are found in markets by scanning market securities with a rectangle pattern charting scanner, checking the profiles of top traders or expert chartered market technicians (CMT), browsing the market charts manually, or by checking trading/investment broker software.
How Do Traders Draw a Rectangle Pattern?
A rectangle pattern drawing involves identifying two or more swing high prices and two or more swing low prices and drawing the pattern components on the chart. Draw a horizontal resistance line from left to right connecting the swing high points together which is the pattern's resistance area. Then, draw a second horizontal support line from left to right that connects the swing low prices together which is the pattern's support area.
How To Trade a Rectangle Pattern
The rectangle pattern trading steps are below.
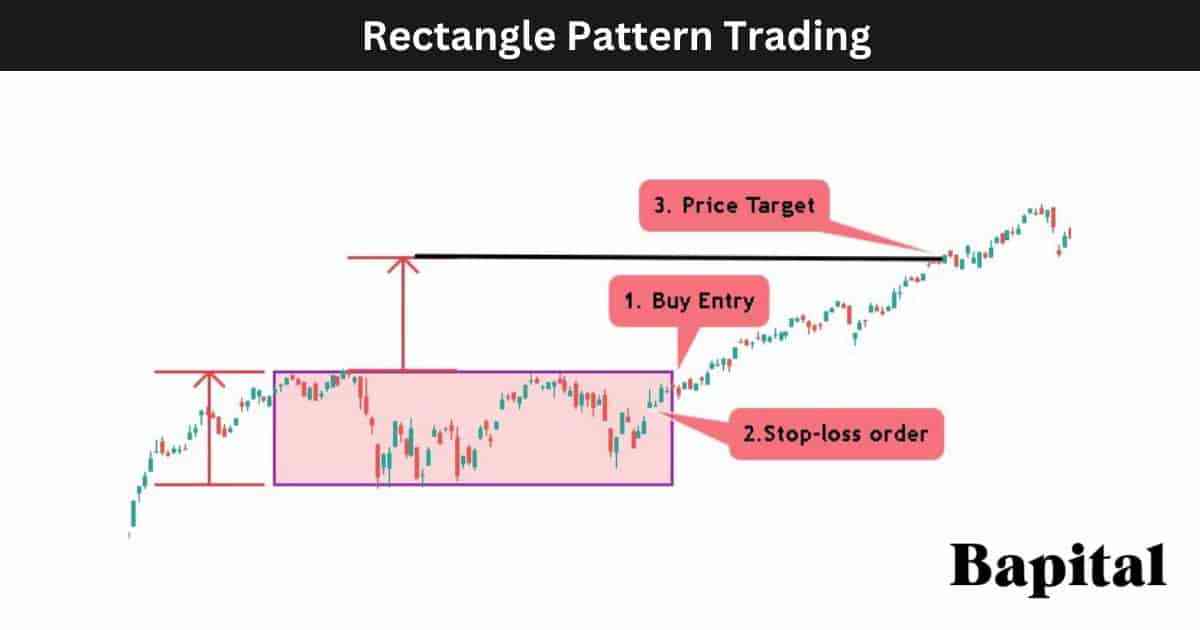
- Enter a buy trade on a pattern breakout or a short trade on a pattern breakdown
- Set the pattern price target order
- Place a stop-loss order at the nearest swing level from the entry price
1. Enter A Buy Trade On A Pattern Breakout Or A Short Trade On A Pattern Breakdown
The first rectangle pattern trading step is the enter a trade when the market price breaks out of the pattern consolidation area.
A bullish rectangle pattern buy trade entry point is set when the price penetrates the resistance zone on increasing buyer volume and the bearish rectangle pattern short trade entry point is set when the prices drops below the pattern support zone on increasing seller volume.
What Is a Rectangle Entry Point?
A rectangle pattern trade entry point is when the price breaks down below the pattern support level or above the pattern resistance level.
2. Set A Pattern Price Target For The Trade
The second rectangle pattern trading step is to set the price target order for the trade by calculating the pattern height and adding/subtracting it from the order entry.
What Is a Rectangle Pattern Price Target?
A rectangle pattern price target is set by measuring the pattern height between the support and resistance levels and adding this calculation to the buy entry price on a bullish rectangle or subtracting this number from the short entry price on a bearish rectangle.
What Is the Rectangle Pattern Price Target Calculation Formula?
The rectangle pattern price target calculation formula is: Rectangle Pattern Target = Entry Price +/- Pattern Height.
3. Place A Stop-Loss Order Above The Pattern Resistance Level
The third rectangle pattern trading step is to place a stop-loss order at the nearest swing point from the trade entry level.
What Is The Rectangle Pattern Risk Management?
A rectangle pattern risk management is set at the nearest swing low point of a bullish breakout candlestick or at the nearest swing high point of the breakdown candlestick.
What Is The Risk/Reward Ratio When Trading Rectangles?
A rectangle pattern risk/reward ratio is 2:1 meaning a reward of $2 for every $1 risked.
What Is a Rectangle Pattern Trading Strategy?
A rectangle trading strategy is the U.S. equities rectangle breakout strategy. Scan the American stock exchanges for stocks forming rectangle patterns. Wait for the stock price to breakout. Enter a buy trade at the price breakout level. Put a 10 simple moving average overlay (SMA) on the finance chart. Place a stop loss just below the 10SMA. Exit the trade when a candlestick closes below the 10SMA. Avoid implementing this strategy in illiquid stocks with under 500,000 daily trading volume.
What Type Of Trading Strategies Can Rectangle Patterns Be Traded In?
Rectangle patterns can be traded in trading strategies including scalping strategies, day trading strategies, swing trading strategies, and long-term position trading strategies.
What Are the Rectangle Pattern Trading Rules?
The rectangle pattern trading rules are below.
- Risk 1% of trading capital total
- Avoid trading rectangles in illiquid markets with low trading volume
- Analyze the rectangle pattern entry point, exit point, and stop loss point prior to trade entry
- Enter a buy trade or short trade at the breakout point only
- Calculate the trade position size prior to trade entry
- Avoid highly volatile markets when trading the pattern
- Avoid trading the rectangle prior to market moving news announcements
What Are Common Mistakes When Trading Rectangles?
The rectangle pattern trading mistakes include not entering a buy or short trade at the correct price level, placing stop-loss orders too far from the trade entry area, and trading the rectangle pattern in poor market conditions with low trade volume.
What Are The Risks Of Trading Rectangles?
The rectangle pattern trading risks include increased volatility causing extreme market price fluctuations, the risk of a gap up or gap down causing trading losses, and the risk of pattern fakeouts causing capital losses to add up.
What Type of Traders Trade Rectangles?
Rectangle pattern traders include scalpers, day traders, swing traders, position traders, technical analysts, and active investors.
What Top Trader Traded Rectangle Patterns?
The top rectangle pattern trader was Nicolas Darvas and his darvas box theory which was a variation of rectangle pattern trading applied in the U.S. stock market. He was the top trader using rectangle patterns as he turned approximately $25,000 into $2 million between 1957 and 1959.
What Are Rectangle Pattern Examples?
Rectangle chart pattern historical examples are displayed below to analyze.
Bullish Rectangle Pattern Example
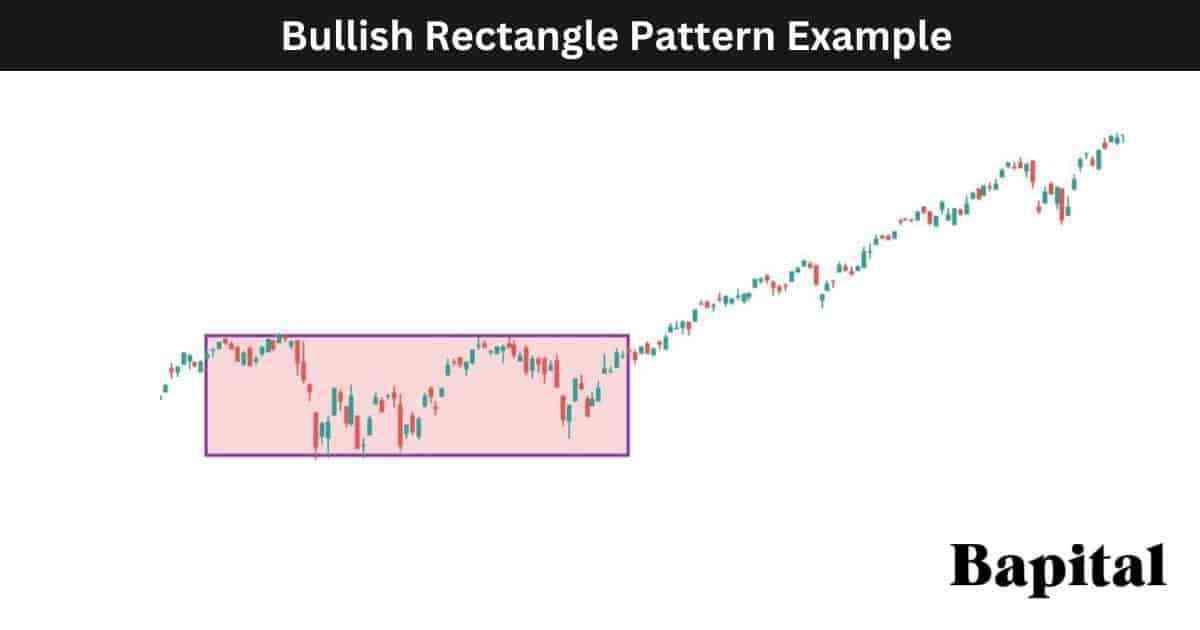
A bullish rectangle pattern example is illustrated on the daily price chart of the S&P500 above. The index price trends higher before a price pause and price consolidation phase forms the rectangle pattern. The S&P500 price breakout occurs and the asset price increases in a bull trend to reach the exit profit target.
Bearish Rectangle Pattern Example
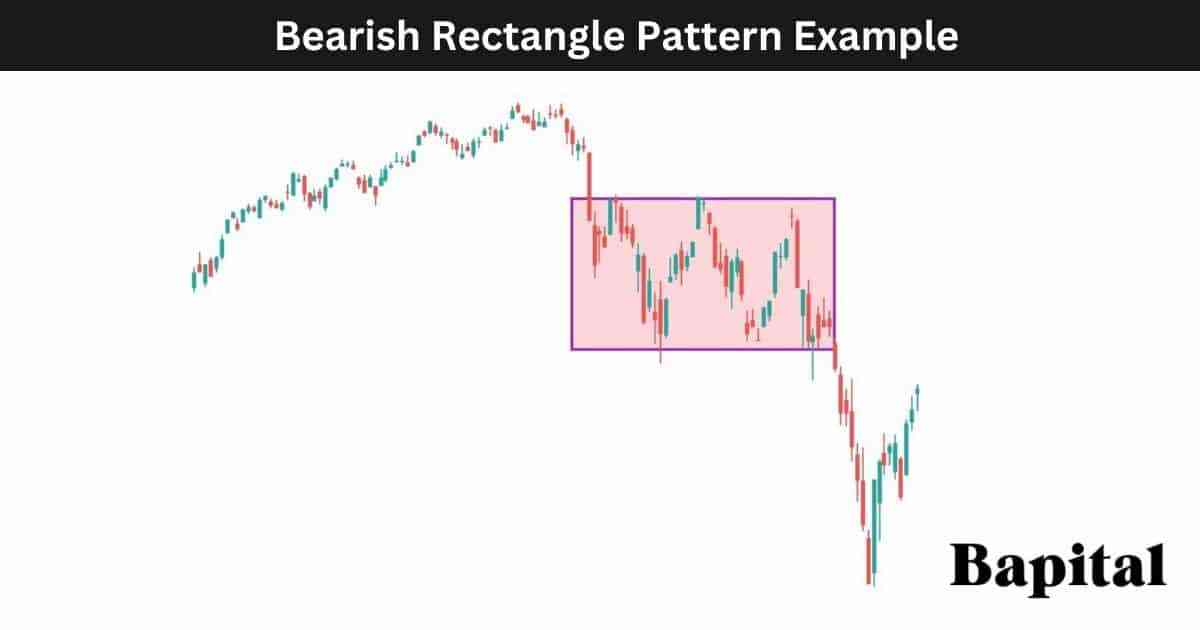
A bearish rectangle pattern example is displayed on the weekly price chart of Alibaba (BABA) above. The stock price forms a rectangle chart pattern before breaking down and moving lower in a bearish trend direction.
Rectangle Reversal Pattern Example
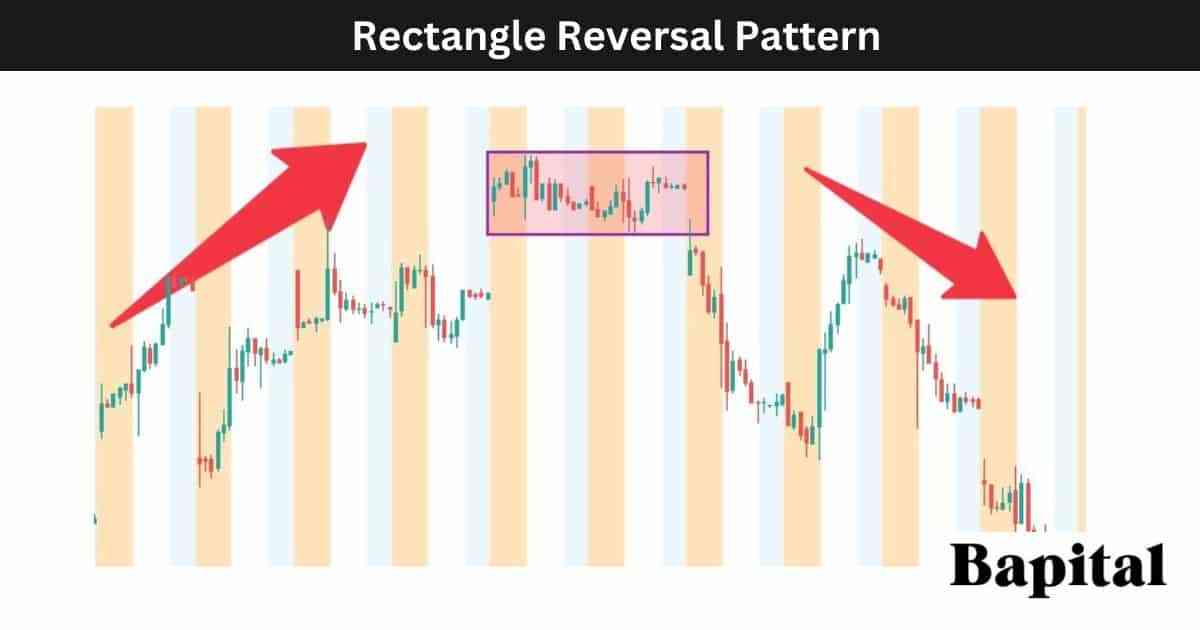
A rectangle reversal pattern example is shown on the hourly price chart of Tesla (TSLA) above. The Tesla stock price originally moves upwards in a bullish direction before a rectangle reversal pattern forms. Tesla price breaks the pattern support point and falls lower in a bearish downtrend.
Rectangle Continuation Pattern Example
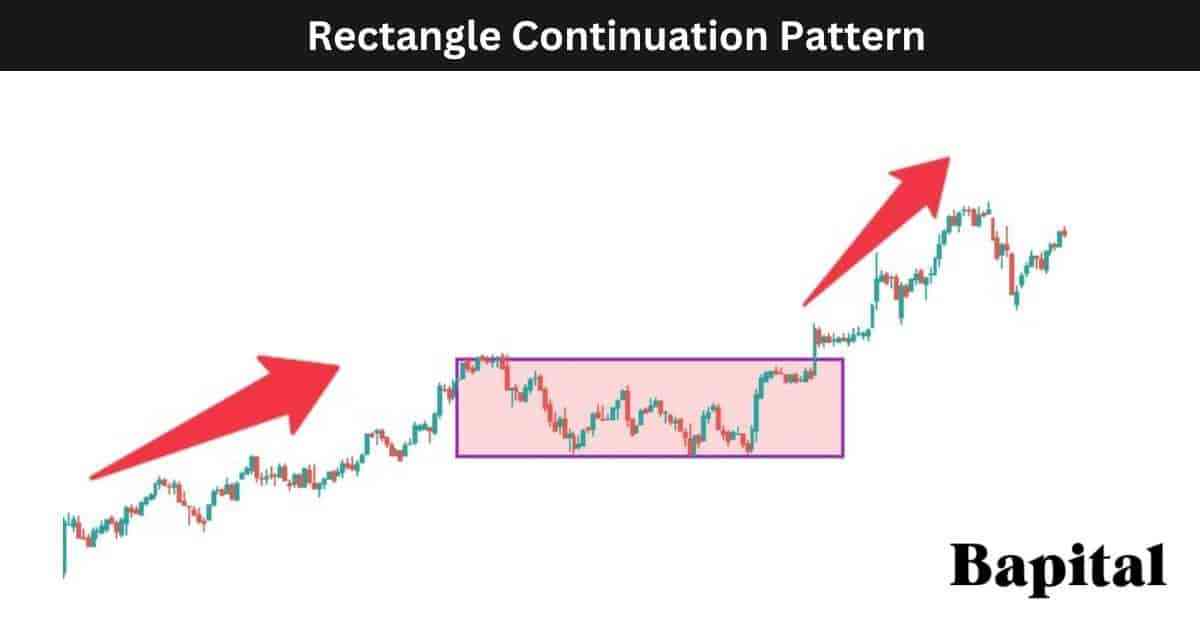
A rectangle continuation pattern example is shown on the daily forex market chart of EUR/USD above. The forex price initially rises in a bullish trend before a price pullback and pause leads to a consolidation period with a rectangle pattern forming. The EUR/USD price starts to trend higher and the bull trend continues.
What Are The Benefits Of a Rectangle Pattern?
The rectangle pattern benefits are listed below.
- Easy To Identify: A rectangle pattern is easy to spot on a price chart as it's simply a rectangle box with a horizontal trend line resistance and support
- Hels Provide Logic To The Market Price Action: A rectangle pattern helps provide logic and understanding of the price action within a market
- Provides Low-Risk Entry Points: A rectangle pattern can help a trader to find low-risk entry points when trading a market
- Helps Traders Avoid Volatile And Choppy Markets: A rectangle pattern helps keep a trader out of a market when the market conditions are not favorable for trading
- Works On Any Timeframe: A rectangle pattern can form and be traded on any timeframe from short term tick charts to long term yearly charts so scalpers, day traders and swing traders can use the pattern
What Are The Limitations Of a Rectangle Pattern?
The rectangle pattern limitations are listed below.
- False Trading Signals: A rectangle pattern can generate many false breakouts and trading signals which can cause trader losses to capital
- Low Win Rate: A rectangle pattern has a low win rate of 36% which some traders may find too low to trade
- Short Price Moves: A rectangle pattern can see prices break out from the pattern with only a small price movement before price reverses and fails
What Technical Indicators Are Used With Rectangle Patterns?
Rectangle patterns are used with technical indicators like moving average overlays, volume indicator, volume profile, volume weighted average price (VWAP), chop zone indicator, ichimoku cloud, linear regression channel, fibonacci extension, pivot points, and parabolic sar.
What Is The Most Popular Technical Indicator Used With Rectangle Patterns?
The rectangle pattern most popular indicator is the volume indicator as it indicates the breakout strength when asset prices move out of a rectangle in a bull direction or bear direction.
What Is The Least Popular Technical Indicator Used With Rectangle Patterns?
The rectangle pattern least popular indicator used is the ichimoku cloud as this indicator can cause confusion when used in conjuction with rectangle patterns.
What Technical Indicator Is Used As A Confirmation Signal With a Rectangle?
The rectangle pattern confirmation technical indicator is the volume indicator as it confirms whether their are large sellers and buyers after a pattern breakout or pattern breakdown.
What Is a Rectangle Pattern Failure?
A rectangle pattern failure, also known as a "failed rectangle", is when a rectangle pattern breakout occurs but prices fail to continue in the breakout direction. The rectangle pattern is invalidated and fails when financial market prices breaks out above the pattern's resistance line or below the pattern's support line but a price reversal occurs and the market price moves in the opposite direction to the price breakout.
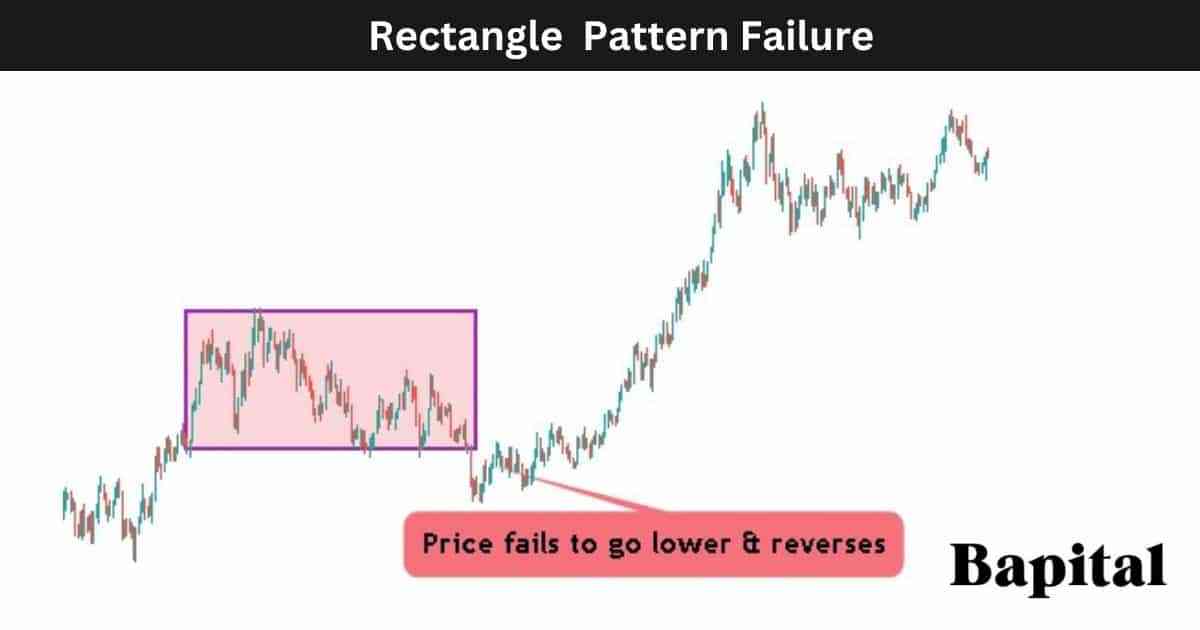
What Causes a Rectangle Pattern To Fail?
The rectangle pattern failure causes are below.
- Lack Of Momentum: A rectangle pattern fails if there is a lack of buying momentum on an upside breakout from the pattern resistance point or a lack of selling momentum on a downside breakdown from the pattern support point
- Low Volume: A rectangle pattern can fail if there is low volume with few buyers and sellers in a market as low volume can cause wild price movements
- Unexpected Positive/Negative News: A rectangle pattern can fail if unexpected positive or negative market news is announced as news can move markets in any direction
- Market Manipulation: A rectangle pattern can fail if a market is manipulated. Markets can be manipulated by order spoofing, fake press releases, and market cornering but this is very rare
What Is The Psychology Behind a Rectangle Pattern?
The rectangle pattern psychology involves traders being in a state of indecision as the market is rangebound with no clear direction.
The bullish rectangle pattern psychology involves traders initially being confused as prices move sideways. As the market price rises, traders become optimistic and confident of a sustained bullish move higher.
The bearish rectangle pattern psychology involves traders initially lacking confidence due to choppy price action. As the market price declines, short traders become confident of a sustained bearish move lower.
When Are Traders Optimistic During the Rectangle Pattern Formation?
Traders are optimistic during a bullish rectangle formation when the price is rising above the resistance level as they anticipate further price increases in a market. Traders are optimistic on a bearish rectangle pattern formation when the price is falling below the support level as they anticipate lower market prices.
When Are Pessimistic During the Rectangle Pattern Formation?
Traders are pessimistic during a bullish rectangle pattern when the market price falls below the support level and continues lower. Traders are pessimistic on a bearish rectangle pattern when the price rises higher above the pattern resistance level and continues rising.
What Are The Statistics Of a Rectangle Pattern?
How Accurate Is a Rectangle Pattern?
The rectangle pattern accuracy rate is 36% across 12,058 pattern examples over the last 8 years.
What Timeframe Has The Highest Rectangle Pattern Win Rate?
The rectangle pattern highest win rate timeframe is the daily price chart with a 42% win rate.
What Timeframe Has The Lowest Rectangle Pattern Win Rate?
The rectangle pattern lowest win rate timeframe is the 1 minute price chart with 31% win rate.
Is a Rectangle Pattern Reliable?
Yes, a rectangle pattern is reliable if proper risk manangement procedures are followed. Factors including risk management, market conditions, and timeframe traded can significantly influence the rectangle pattern's reliability.
Is a Rectangle Pattern Profitable?
Yes, a rectangle pattern is profitable as the average success rate is 36% and the average return to risk ratio is 2 to 1. This means for every 100 trades, a trader wins 36 trades making 2 units (72 units total) and loses 64 trades losing 1 unit (64 units total). Therefore, over 100 trades, a trader should hypothetically net 8 units (72 units - 64 units). Be aware that past performance is not indicative of future results.
How Can Traders Make a Rectangle Pattern More Profitable?
A trader can make a rectangle pattern more profitable by only trading the pattern on the daily timeframe market chart as this timeframe sees the trade win rate increase to 42%.
What Are Rectangle Pattern Alternatives?
The rectangle pattern alternatives are listed below.
- Bull flag
- Price Channels
- Bear flag
- Cup and handle
- Ascending triangle pattern
- Descending triangle pattern
- Symmetrical triangle chart pattern
- Inverse head with shoulders pattern
- Head with shoulders pattern
- Pennants
- Bump and run reversal chart pattern
- Double bottom pattern
What Is The Most Popular Rectangle Pattern Alternative?
A rectangle pattern's most popular alternative is the double bottom pattern.
What Is The Opposite Of a Rectangle Pattern?
The rectangle pattern's opposite is the channel pattern which is price channels with upward and downward sloping resistance and support levels.
What Are Rectangle Pattern Resources To Learn From?
Rectangle pattern resources to learn from include books, websites, and courses.
What Are Books To Learn About Rectangle Patterns?
Rectangle pattern books to learn from are "Technical Analysis of Financial Markets" by technical analyst John Murphy and "Technical Analysis The Complete Resource for Financial Market Technicians" (page 660) by Charles D. Kirkpatrick II and Julie R. Dahlquist.
What Are Websites To Learn About Rectangle Patterns?
Websites to learn about rectangle patterns are Bapital.com and Stockcharts.com.
What Are Courses To Learn About Rectangle Patterns?
Courses to learn about rectangle patterns are "The Ultimate Chart Patterns Trading Course" by Rayner Teo and "Intermediate and advanced chart patterns" by Tradimo.
