What Is a Rising Wedge Pattern In Technical Analysis?
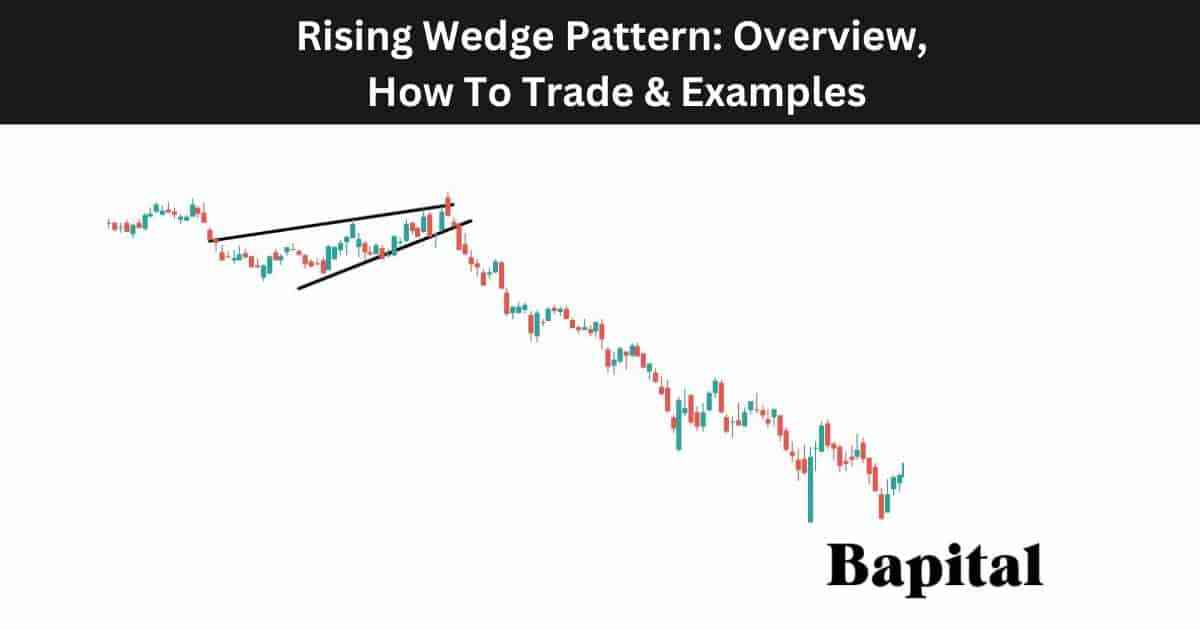
A rising wedge pattern is a pattern in technical analysis that indicates bearish price trend movement after a price breakdown. Rising wedge patterns are considered a bearish reversal pattern when they form at the end of a bullish trend. The rising wedge chart pattern is considered a bearish continuation pattern when it forms during an already established bearish downtrend. Rising wedges have two converging upward sloping resistance and support trendlines.
What Is An Alternative Name For a Rising Wedge Pattern?
A rising wedge pattern's alternative name is "ascending wedge pattern" or "bearish wedge pattern".
What Is The Importance Of a Rising Wedge Pattern In Technical Analysis?
The rising wedge pattern is important in technical analysis as it often signals a potential reversal in the prevailing bullish trend and it is important as it enables traders to capture large bearish trend movements from a low risk entry point.
Is a Rising Wedge Pattern Bullish or Bearish?
A rising wedge pattern is a bearish signal that indicates future price decreases in a market. It is not a bullish signal.
Is a Rising Wedge Pattern a Continuation or Reversal Pattern?
A rising wedge pattern can be either a continuation chart pattern or a reversal chart pattern depending on the market environment. A rising wedge pattern is a continuation pattern when it forms after a price consolidation in a bearish downtrend and a rising wedge is a reversal pattern when it forms after a price consolidation during a bullish uptrend.
What Are The Components Of a Rising Wedge?
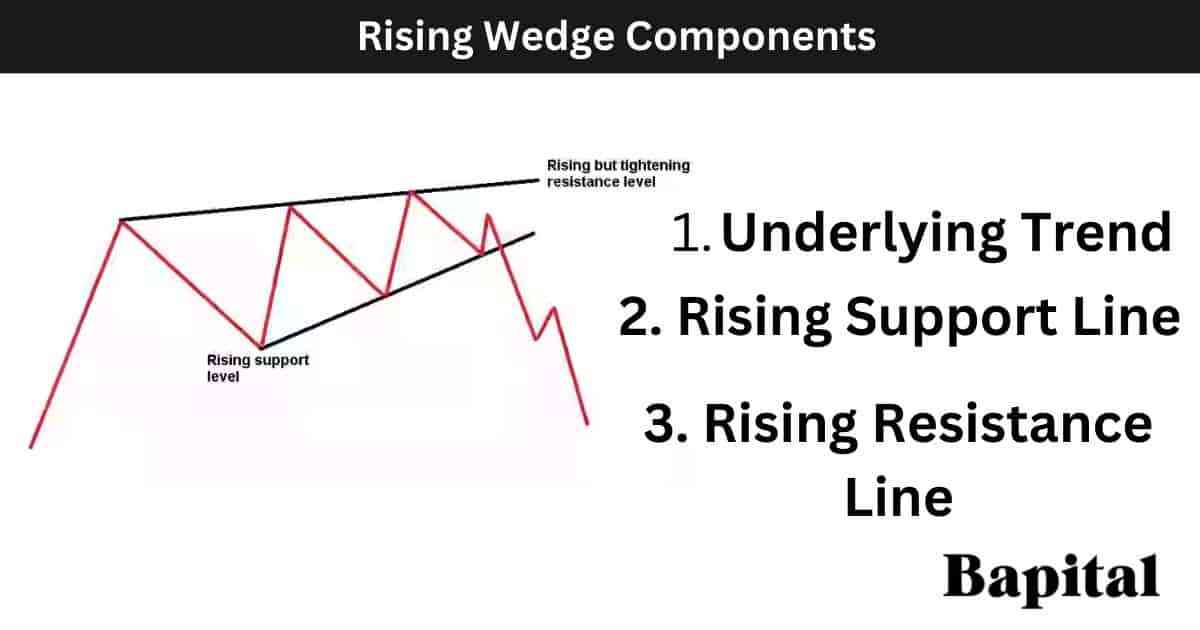
The rising wedge pattern components are an underlying bullish or bearish trend component, price consolidation component, rising resistance trendline component, and a rising support trendline component.
What Is The Formation Process Of a Rising Wedge Pattern?
The rising wedge pattern formation process begins with a price uptrend with market prices converging between higher swing low points and higher swing high points.
Secondly in the rising wedge formation process is the identification of the resistance and support trendlines. Traders identify two key trend lines that define the rising wedge which are the upward sloped resistance line and the upward sloping support line.
Thirdly in the rising wedge formation process is reduced volatility and price contracting as the security prices moves up. As teh rising wedge evolves, volatility and price fluctuations decreases. It is during this formation phase that the two trendlines can be drawn.
Fourthly in the formation process is volume declining. The diminishing volume as price continues higher indicates a weakening in buying pressure.
Fifthly in the formation process is the completion of the rising wedge pattern when the price decreases below the rising support trendline. At this stage, the pattern is considered formed, but it is not yet confirmed.
What Happens After a Rising Wedge Forms?
After a rising wedge pattern forms, the market price drops below the lower rising support trendline and continues a price decline with lower swing high peaks and lower swing low troughs forming as prices drop in a bearish direction with increasing bearish momentum.
What Causes a Rising Wedge Pattern To Form?
A rising wedge pattern is caused by shifting supply and demand market dynamics with buyers slowly reducing the buying pressure as the price reaches exhaustion levels.
During this trend exhaustion phase, a narrow price consolidation occurs whereby the pattern support and resistance trendlines can be plotted. This price consolidating period is caused by traders indecisions and buyers selling their trade positions.
Eventually, the market price begins to reverse from bullish to bearish and large sellers and the price starts dropping. This price drop is caused by large sellers shorting the market and traders with long positions panic selling for fears of losing their unrealized gains.
How Long Does a Rising Wedge Pattern Take To Form?
A rising wedge pattern takes a minumum of 30 days to form on a daily timeframe chart. To calculate the formation duration of a rising wedge, multiple the timeframe by 30. For example, a rising wedge pattern on a 30 minute price chart would take a minimum of 900 minutes (30 minutes x 30) to form.
How Often Do Rising Wedge Patterns Form?
Rising wedge patterns form 4 to 6 times per year on a daily timeframe price chart depending on market conditions.
How To Identify a Rising Wedge Pattern
Identifying a rising wedge pattern involves recognizing specific visual and characteristics of the rising wedge pattern on a financial price chart graph.
First, identify a market uptrend, where prices form higher highs and higher lows. As the uptrend progresses, look for a narrowing price range between two converging trendlines. The first trendline is the upper resistance line that is sloped upwards and connects the higher swing highs together. The second trendline is the lower support line that is sloped upwards and connects the higher swing lows together.
Identify pattern completion when the price breaks below the support level and trends lower.
How Do Traders Find Rising Wedge Patterns?
Rising wedge pattern formations are found in markets by scanning the financial markets with a rising wedge charting scanner, checking the online profiles of top traders or expert chartered market technicians (CMT), browsing the market charts manually, or by checking trading/investment broker software.
How Do Traders Draw a Rising Wedge Pattern?
Rising wedge pattern drawing involves identifying two higher swing low points and two higher swing higher points and drawing the lines on the chart connecting them. Draw a rising trendline from left to right connecting the higher swing high peaks together which is the pattern's resistance level.
Draw a second rising support trendline from left to right connecting the higher swing low price points together whih is the pattern's support level.
What Markets Do Rising Wedge Patterns Form In?
A rising wedge pattern forms in all markets including capital markets, money markets, derivatives markets, foreign exchange markets, commodity markets, cryptocurrency markets, interbank markets, over the counter (OTC) markets, equity markets, and fixed-income markets.
What Timeframes Do Rising Wedge Patterns Form On?
Rising wedge patterns form on all timeframes from short term tick charts to longer-term yearly timeframe price charts.
What Is The Most Popular Timeframe To Trade Rising Wedge Patterns?
The most popular timeframe to trade a rising wedge pattern is the daily price chart.
What Is The Least Popular Timeframe To Trade Rising Wedge Patterns?
The least popular timeframe to trade a rising wedge pattern is the 1-second timeframe price chart.
How To Trade a Rising Wedge Pattern
The rising wedge pattern trading steps are listed below.
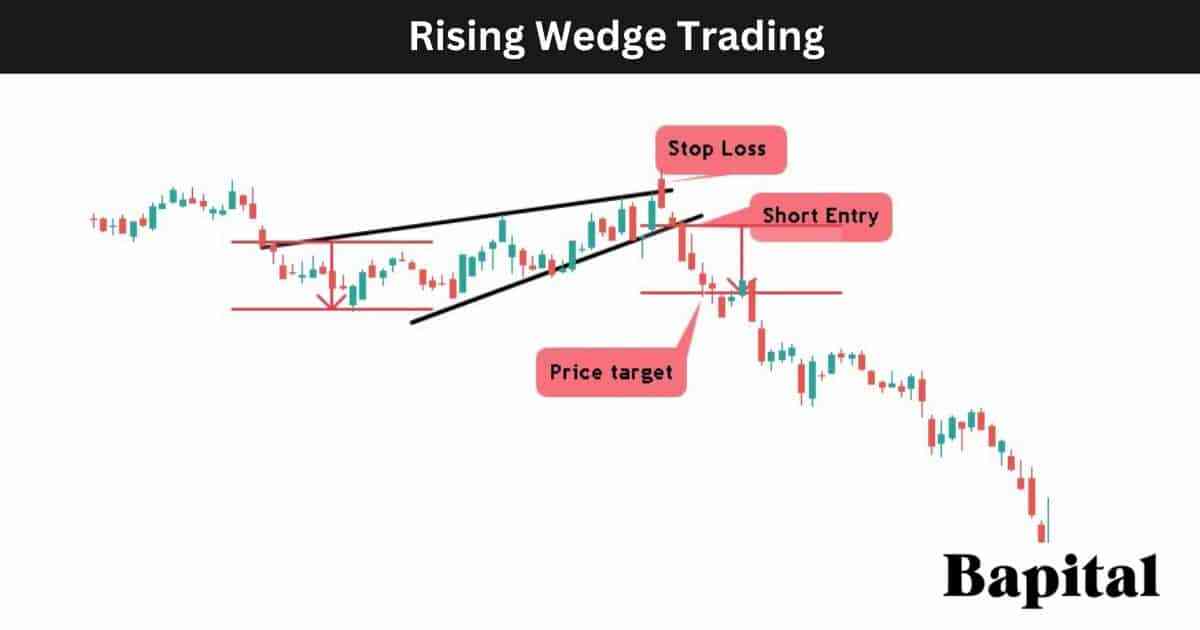
- Enter a short trade as price declines below the pattern support point
- Set a price target order
- Place a stop-loss order above the pattern resistance level
1. Enter A Short Trade As Price Declines Below The Pattern Support Point
The first rising wedge trading step is to enter a short trade position when the asset price drops below the upward resistance level. As the price penetrates this level, watch for increasing bearish volume.
What Is a Rising Wedge Entry Point?
A rising wedge pattern short entry point is set when the financial market price penetrates the uptrending support line in an downward bearish direction.
2. Set A Price Target For The Trade
The second rising wedge trading step is to set the profit target order by calculating the pattern height and subract this number to the short entry price to get the target price level.
What Is a Rising Wedge Pattern Price Target?
A rising wedge pattern price target is set by measuring the pattern height between the rising resistance line and rising support line and subtracting this height from the short entry price point.
What Is the Rising Wedge Pattern Price Target Calculation Formula?
The rising wedge pattern price target calculation formula is: Rising Wedge Price Target = Short Entry Price - Pattern Height.
3. Place A Stop-Loss Order Above The Pattern Resistance Level
The third rising wedge pattern trading step is to place a stop-loss order at the uptrending resistance line. Allow for potential order slippage when placing this stop-loss order.
What Is The Rising Wedge Pattern Risk Management?
A rising wedge pattern risk management involves placing a stop-loss order at the upward sloping resistance level of the pattern. The stop-loss order can be a limit stop-loss order or a market stop-order. Account for order slippage when placing the stop-loss.
What Is The Risk/Reward Ratio When Trading Rising Wedges?
A rising wedge pattern risk/reward ratio is 3:1 meaning a reward of $3+ for every $1 risked.
What Is a Rising Wedge Pattern Trading Strategy?
A rising wedge trading strategy is the 10EMA Rising Wedge U.S. Market Securities Breakdown Strategy.
Scan all the U.S. equities for rising wedge pattern formations. Put a 10 exponential moving average overlay on the stock finance charts. Enter a short trade when the stock price breaks below the pattern support level on increasing seller volume (red bars). Put a stop-loss order at the 10EMA price. Use a trailing stop-loss along the 10EMA. Exit the trade when the market price bar closes above the 10EMA.
What Type Of Trading Strategies Can Rising Wedge Patterns Be Traded In?
Rising wedge patterns are trading in scalping strategies, day trading strategies, swing trading strategies, and long term trading strategies.
What Are the Rising Wedge Pattern Trading Rules?
The rising wedge pattern trading rules are listed below.
- Risk 1% of trading capital total
- Know the trade entry price, exit price, and stop-loss price prior to trade entry
- Avoid trading the pattern prior to important economic, political, or corportate news announcements
- Avoid trading the pattern in illiquid markets
What Are Common Mistakes When Trading Rising Wedges?
The rising wedge pattern trading mistakes are trading before short entry point confirmation which can cause unnecessary capital losses, incorrectly calculating the wrong exit price level, and trading the pattern with large position sizes.
What Are The Risks Of Trading Rising Wedges?
The rising wedge pattern trading risks are a risk of a price gap up causing a trading loss, risk of unexpected bullish news causing increased market volatility, and the risk of low trading liquidity causing trade slippage.
What Type of Traders Trade Rising Wedges?
A rising wedge pattern is traded by scalpers, day traders, swing traders, position traders, long-term traders, technical analysts, and active investors.
What Are Rising Wedge Pattern Examples?
Rising wedge chart patterns are displayed on historical price chart examples below.
Rising Wedge Reversal Pattern Example
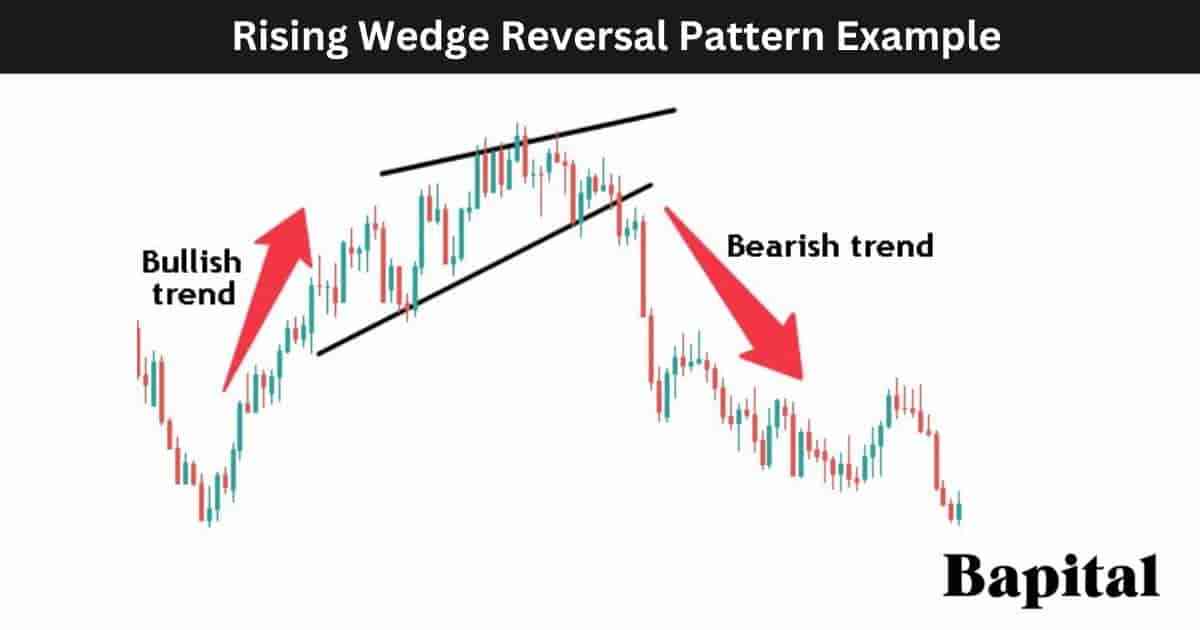
A rising wedge reversal pattern example is illustrated on the daily forex price chart of EUR/USD above. The currency price initialy trends higher in a bullish direction before reaching a market top where the rising wedge forms. The EUR/USD price reverses and falls lower in a bear downtrend.
Rising Wedge Continuation Pattern Example
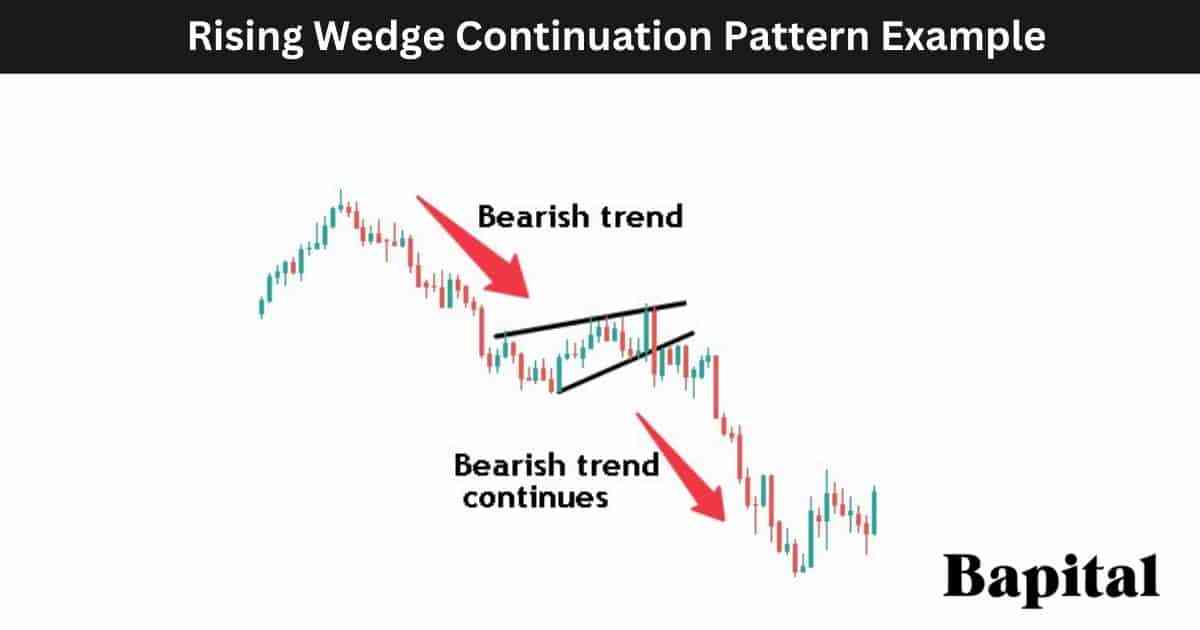
a rising wedge continuation pattern example is displayed on the daily Gold futures chart above. The futures price is dropping in a bear trend before a price pause and rising wedge formation. The Gold price drops lower below the pattern support area and continues to move lower over the next few weeks in a broader bearish trend direction.
Rising Wedge Pattern Short Timeframe Example
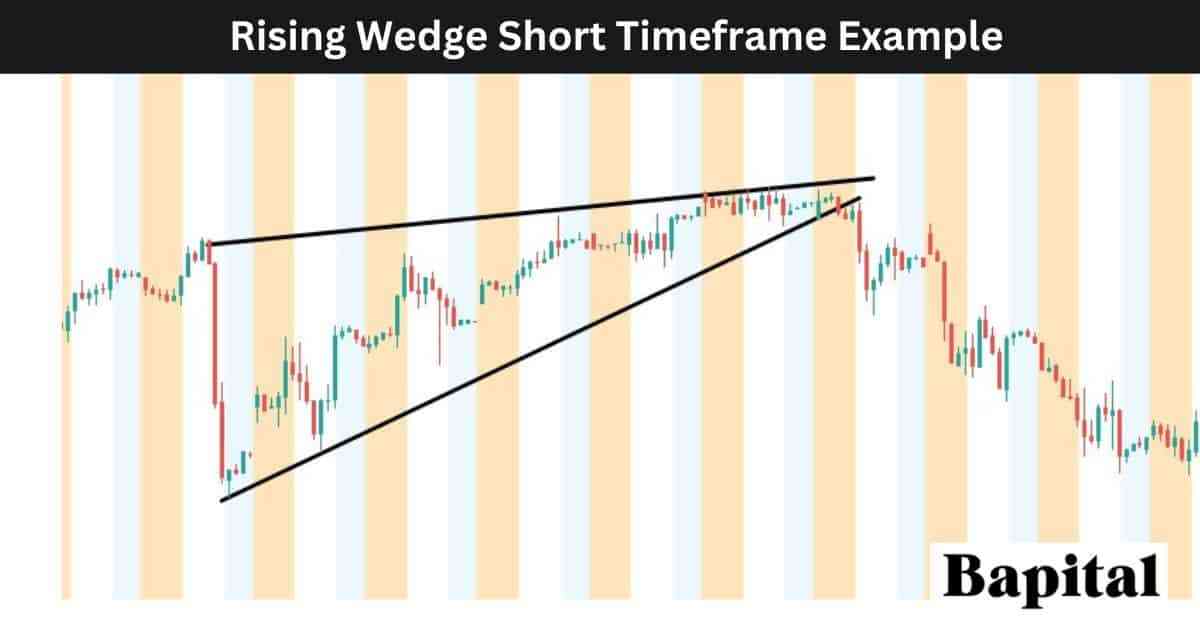
A rising wedge short timeframe example is shown on the 1 hour SPY chart above. The SPY price trends slowly higher in a bull direction while forming the rising wedge pattern. A bullish price exhaustion occurs, the price reverses and trends lower with increased bearish momentum.
Rising Wedge Pattern Long Timeframe Example
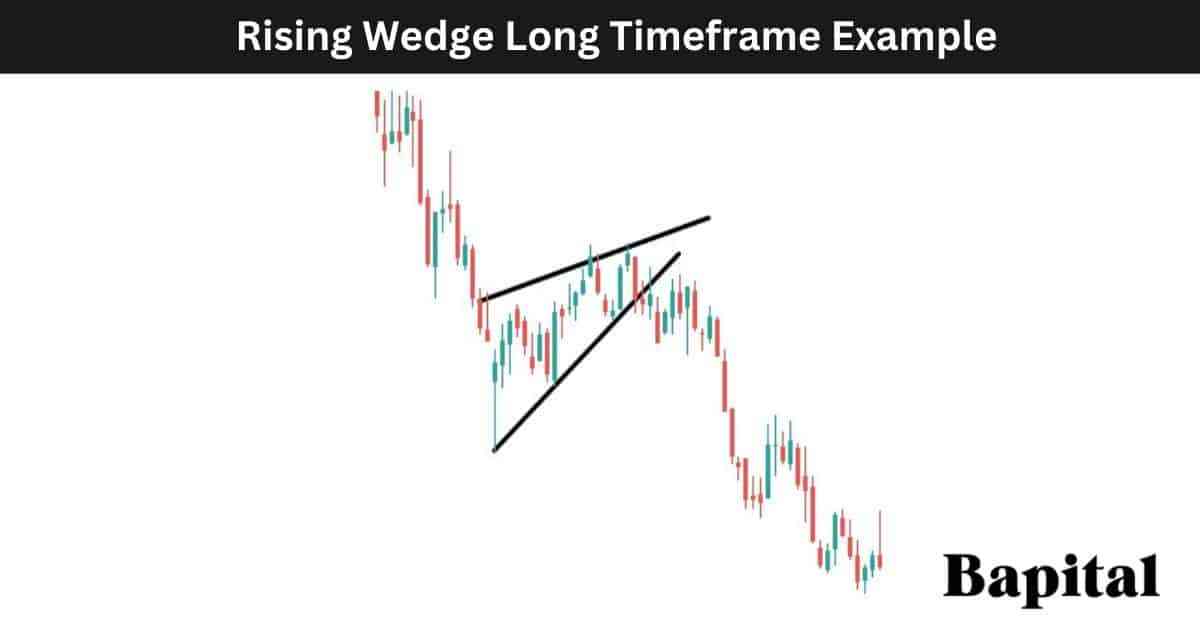
A rising wedge long timeframe example is displayed on the weekly stock chart of Rivian Automotive (RIVN) above. The stock price initially decreases lower before a price rangebound sideways period where the rising wedge forms. RIVN stock price penetrates the pattern support point and falls to much lower prices over the next 4 months.
What Are The Benefits Of a Rising Wedge Pattern?
The rising wedge pattern benefits are listed below.
- Helps Identify Trend Exhaustion: A rising wedge formation can signal potential bullish trend. Traders use this pattern as a warning sign of waning bullish momentum, providing an opportunity to reassess positions or consider a reversal short trade
- Clearly Defined Entry Point: The rising wedge pattern offers clear shorting trade entry points with no ambiguity as to the trade entry price
- Applicability Across Time Frames: The rising wedge pattern can be identified on all trading time frames, from intraday charts to long-term charts. This versatility allows traders to apply the pattern in different trading time horizons
- Improves Price Action Understanding: The rising wedge pattern helps improve a traders understanding of market price action
- High Return to Risk Ratio: Rising wedges offer a high 3:1 return to risk ratio
What Are The Limitations Of a Rising Wedge Pattern?
The rising wedge pattern limitations are listed below.
- Fakeouts: A rising wedge pattern sometimes creates fake breakdowns whereby the price penetrates the pattern support level but quickly reverses causes traders to get stopped out of their trade position
- Subjectivity: A rising wedge pattern identity involves subjectivity and one trader can interpret this pattern differently to another which can cause issues when trading it
- Pattern May Stop Working: A rising wedge pattern may stop working as financial markets are dynamic, and while the rising wedge is historically reliable, it may lose its trade effectiveness over time. Traders should adapt their strategies and consider a combination of technical and fundamental analysis
What Technical Indicators Are Used With Rising Wedge Patterns?
Rising wedge patterns are used with technical indicators like the volume indicator, moving average overlays, elliott waves, bollinger bands, keltner channels, R.S.I. oscillator, accumulation/distribution line, chaikin money flow, and the parabolic sar.
What Is The Most Popular Technical Indicator Used With Rising Wedge Patterns?
The rising wedge pattern most popular indicator used is the volume indicator as it helps traders understand the weakness and selling pressure after a pattern price breakdown.
What Is The Least Popular Technical Indicator Used With Rising Wedge Patterns?
A rising wedge pattern least popular indicator used is the chaikin money flow as it creates false trade signals wwhen combined with the pattern.
What Technical Indicator Is Used As A Confirmation Signal With a Rising Wedge?
A rising wedge pattern confirmation technical indicator is the volume indicator as the volume indicator confirms large seller presence after a pattern breakout.
What Is a Rising Wedge Pattern Failure?
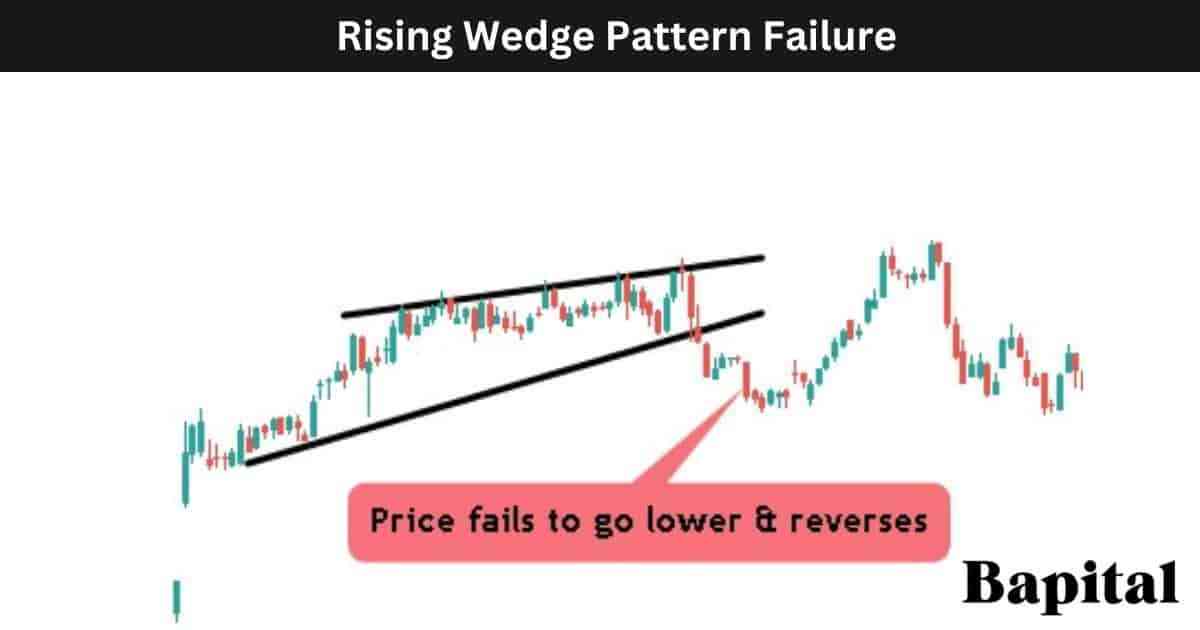
A rising wedge pattern failure, also known as a "failed ascending wedge", is when the rising wedge pattern forms but market prices fail to continue lower. The rising wedge pattern is invalidated and fails when the market price breaks below the short trade entry point in a bearish movement but the price reverses from below the pattern support breakdown level to trend upwards above the pattern's increasing resistance level. A failed rising wedge pattern is a bullish signal in capital markets.
What Causes a Rising Wedge Pattern To Fail?
The rising wedge pattern failure causes are below.
- Unexpected Positive Market News: A rising wedge pattern fails if unexpected positive news is announced causing the market price to rise higher
- High Bid/Ask Spread: The rising wedge pattern can fail if there is a large distance between a bid/ask spread which means low trading liquidity. A large spread skews the risk/reward ratio and can cause a pattern failure
- Major Underneath Support: The rising wedge pattern can fail if there is a strong support area directly below the pattern breakdown point. This support level can cause a price bounce and ultimately cause a failed pattern
What Is The Psychology Behind a Rising Wedge Pattern?
The rising wedge pattern psychology involves an initial bullish postive sentiment as the price rises. As the price reaches resistance, traders start to show caution and pessimism of the market moving higher. As the price narrows further between a price pullback and price bounce, traders express a lack confidence on the correct price trend direction. As the price breaks down, short traders are hopeful of further price declines while buy traders are nervous of falling prices.
When Are Traders Optimistic During the Rising Wedge Pattern Formation?
Short traders are optimistic as the market price penetrates the support line and trends lower as they anticipate further price declines.
When Are Pessimistic During the Rising Wedge Pattern Formation?
Long traders are pessimistic as the price breaks down below the pattern support line as they are losing money as the trade position goes against them.
What Are The Statistics Of a Rising Wedge Pattern?
Rising wedge pattern statistics are illustrated on the statistics table below. All rising wedge pattern statistical data has been calculated by backtesting historical data of financial markets.
How Accurate Is a Rising Wedge Pattern?
A rising wedge pattern accuracy rate is 43% over 6,863 historical examples over the last 10 years.
What Timeframe Has The Highest Rising Wedge Pattern Win Rate?
The rising wedge pattern's highest win rate is 56% on the daily price charts over 459 historical price chart examples.
What Timeframe Has The Lowest Rising Wedge Pattern Win Rate?
The rising wedge pattern's lowest win rate is 32% on the 1-second timeframe chart over 841 examples.
Is a Rising Wedge Pattern Reliable?
Yes, a rising wedge pattern is reliable with a 43% average win rate.
Is a Rising Wedge Pattern Profitable?
Yes, rising wedge patterns are profitable with a win rate of 43% and a high return ratio of 3:1 making them profitable. However, past performance is not always indicative of future results.
How Can Traders Make a Rising Wedge Pattern More Profitable?
Traders make rising wedge patterns more profitable by trading the pattern on higher timeframe charts and avoiding lower timeframes that are less reliable with more false signals.
What's The Difference Between a Rising Wedge and a Bear Flag Pattern?
A rising wedge pattern difference with a bear flag is its shape with a rising wedge shaped with two converging upward sloping resistance and support lines while a bear flag is shaped with two parallel rising support and resistance levels and a downward sloping flagpole.
What Are Rising Wedge Pattern Alternatives?
Rising wedge pattern alternatives are listed below.
- Bear flag pattern
- Bump & run reversal
- Double top chart pattern
- Triple top chart pattern
- Diamond top chart pattern
- Rounded top price pattern
What Is The Most Popular Rising Wedge Pattern Alternative?
The rising wedge pattern's most popular alternative is the bear flag pattern.
What Is The Opposite Of a Rising Wedge Pattern?
A rising wedge pattern's opposite is a falling wedge pattern. A rising wedge looks like an inverted falling wedge.
What Are Rising Wedge Pattern Resources To Learn From?
Rising wedge pattern resources to learn from include books, audiobooks, pdfs, websites, and courses.
What Are Books To Learn About Rising Wedge Patterns?
Rising wedge pattern books to learn from are "Technical Analysis of Financial Markets" by technical analyst John Murphy and "Getting Started In Chart Patterns" by Thomas Bulkowski.
What Are Websites To Learn About Rising Wedge Patterns?
Websites to learn about rising wedge patterns are Bapital.com and Investopedia.com.
What Are Courses To Learn About Rising Wedge Patterns?
Courses to learn about rising wedge patterns are "Technical Analysis: Chart Pattern Trading For Beginners" by Wealthy Education and "Introduction To Technical Analysis" by the Chart Guys.
What Are the Rising Wedge Pattern Key Facts?
The rising wedge pattern key facts are below.
