What Is A Rounding Top Chart Pattern?
In technical analysis, a rounding top pattern, also known a a "rounded top", is a bearish reversal price pattern that forms at the end of a bullish uptrend. The pattern is shaped like an upside-down letter "U" and it signals that the price of a market will reverse from bullish and rising prices to bearish and declining prices.
During the formation period of the rounding top pattern, the volume level declines as the price forms the upside-down U shape before increasing in selling pressure volume as it breaks down below the support level of the pattern.
Rounding Top Pattern Components
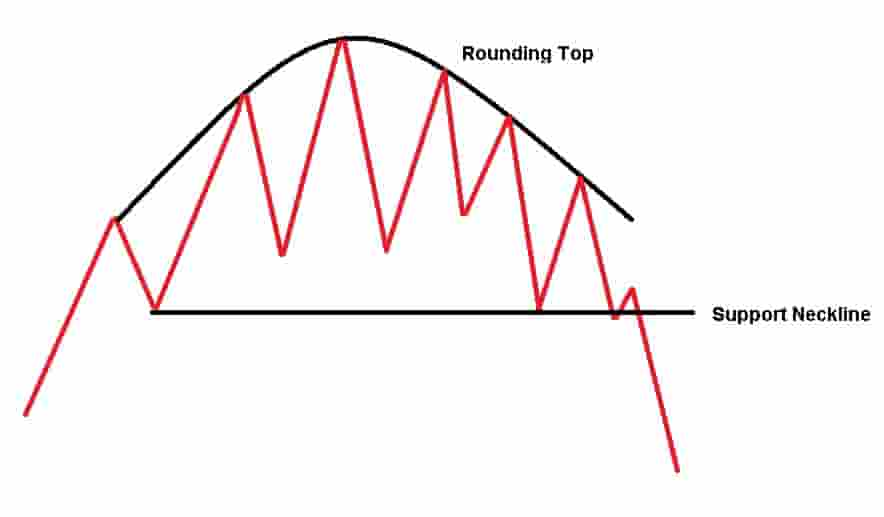
In order to identify a rounding top pattern, there will need to be two components visible on the price chart of a market.
The components of the rounding top pattern are:
- A rounding top: This is the upside-down "U" shape or the rounding top that connects the price action together as it moves in the shape of an upside-down U shape.
- Neckline support level: This is the support level that is sometimes referred to as the "neckline". This is the area where a trader will enter a short trade when trading this pattern.
Drawing this rounding top pattern involves combining the two components of the rounding top and the neckline support level together.
Rounding Top Chart Pattern Examples
Below are visual examples of the rounding top chart pattern.
Example Of A Rounding Top Pattern In The Stock Market
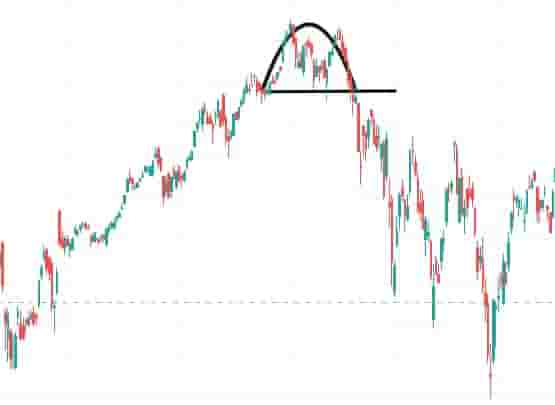
In the daily price chart of Amazon stock, a rounding top pattern formed. It formed at the end of a bullish trend and resulted in a price reversal from bullish to bearish price action with increased selling pressure.
Example Of A Rounding Top Pattern In The Commodity Market
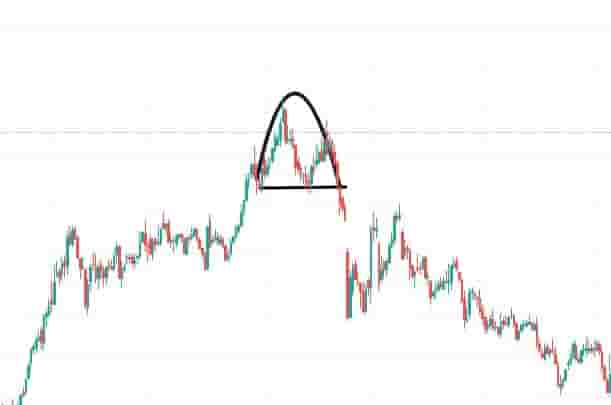
On the daily price chart of Soybeans futures, a rounded top pattern formed.
The price of Soybean futures increased higher before the rounded top pattern signaled a price reversal.
Once the price of Soybean futures breaks down below the support level, it resulted in declining prices over the next few months.
Example Of A Rounding Top Pattern On A Shorter Timeframe Price Chart
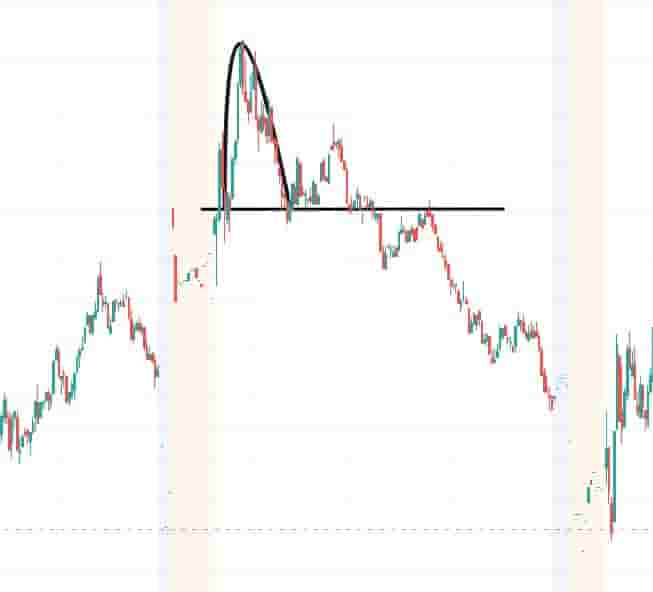
In the 3-minute price chart of Tesla stock above, a rounding top pattern formed. It resulted in a fast move lower in the price of the stock.
Scalpers and day traders can trade the rounding top pattern on shorter timeframe price charts.
Example Of A Rounding Top Pattern On A Higher Timeframe Price Chart
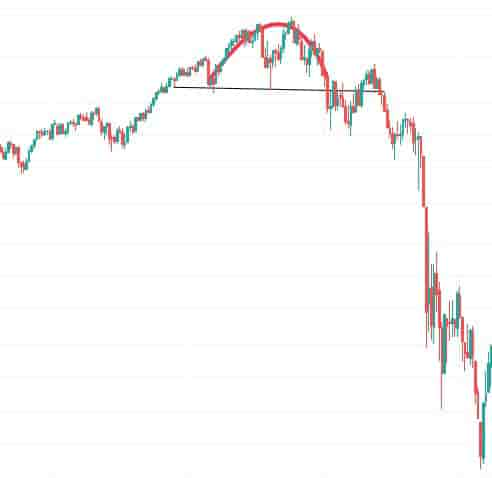
On the S&P500 weekly price chart above, a rounding top pattern formed. It resulted in a very large bearish price move over the next year.
This is an example of the rounding top pattern forming and be applied to higher timeframe price charts.
How To Find Rounding Top Patterns
The methods for finding rounding top patterns in the market are:
- Manually look through the price charts of markets: A trader can manually browse the price charts of financial markets to find rounding top patterns.
- Use a rounding top pattern scanner: Traders can use a rounding top pattern scanner to automatically scan for the rounding top patterns.
Rounding Top Pattern Benefits
The benefits of the rounding top patterns are:
- It can help a trader to capture market reversals: A rounding top pattern can help a trader to capture price reversals and bearish trends in the market from a low-risk short entry point.
- It offers a high reward to risk ratio: A rounding top pattern can offer a very high reward to risk ratio when a trade is successful, in some instances risking $1 to make $3+.
- It is easy to learn: New traders find learning about the rounding top pattern easy as there are very few components to the pattern to understand and it is easy to spot on a price chart.
- It can provide logic and understanding to the price action: Spotting a rounding top pattern can help a trader to understand the price action and it can provide clear logic that the market is topping out and that prices may reverse.
- It can be used in any market and in any timeframe: The rounding top pattern can be used in any market and on any timeframe of price chart without any restrictions.
Rounding Top Pattern Limitations
The limitations of rounding top patterns are:
- It can create many false signals: A rounding top pattern can create many false shorting signals. This can frustrate traders trying to capture the bearish move in a market.
- It is not accurate 100% of the time: A rounding top pattern, as with all chart patterns, is not always accurate. New traders get frustrated that the pattern offers losing short signals from time to time.
Rounding Top Formation Duration
The length of time a rounding top will take to form depends on the timeframe of the price chart used.
Example durations for a rounding top pattern to form include:
- 30 minutes minimum for a rounding top pattern to form on a 1-minute price chart.
- 120 hours minimum for a rounding top pattern to form on a 4- hour price chart.
- 30 days minimum for a rounding top pattern to form on a daily price chart.
- 30 weeks minimum for a rounding top pattern to form on a weekly price chart.
Frequently Asked Questions About The Rounding Top Pattern
Below are frequently asked questions about the rounding top chart pattern.
Is A Rounding Top Pattern Bullish?
No, a rounding top pattern is a bearish signal that indicates that the price will go lower.
Is A Rounding Top Pattern A Continuation Pattern?
No. A rounding top pattern is a bearish reversal pattern. It signals that the price of a market may decline lower in prices.
What Is The Opposite Of A Rounding Top Pattern?
The opposite of a rounding top pattern is a rounding bottom pattern. A rounding bottom pattern signals future bullish prices.
What Price Chart Timeframes Can A Rounding Top Pattern Form On?
A rounding top pattern can form on any timeframe of price chart from short term tick charts to higher timeframe monthly and yearly charts.
What Does A Rounding Top Pattern Tell You?
A rounding top pattern tells a trader or technical analyst that the market is struggling to move higher and that the price may reverse from a bullish trend to a bearish trend.
