What Is A Symmetrical Triangle Chart Pattern?
In technical analysis, a symmetrical triangle chart pattern, also known as the "coil", is a chart pattern formation that forms when two converging lines connect the swing highs and the swing lows of the prices of a market together. The symmetrical triangle can be either a bullish or bearish signal depending on which direction the price breaks out from the pattern.
The symmetrical triangle pattern is most commonly found as a continuation pattern meaning it could form during a bullish trend and lead to continued bullish action or vice versa for a bearish trend.
A symmetrical triangle can also be used as a price reversal pattern which means it could form during one direction of a trend and then the price can reverse and trend in the opposite direction after completion of the pattern. However, this is not as common.
Symmetrical Triangle Pattern Components
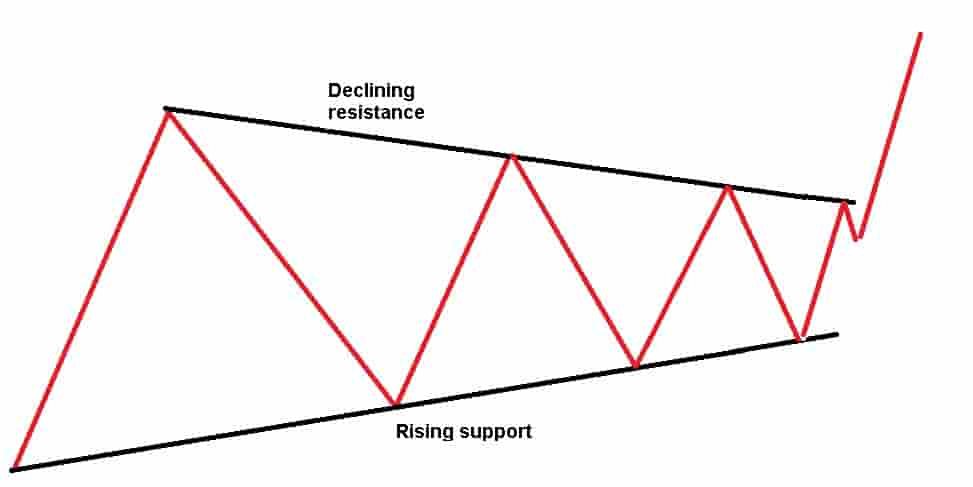
In order to identify a symmetrical triangle chart pattern, there will need to be two components visible on the price chart.
The 2 components of a symmetrical triangle chart pattern are:
- A declining resistance level: This is the upper declining resistance level that connects the lower swing highs or the peaks of the prices together on a chart.
- A rising support level: This is a lower rising support level that connects the higher swing lows or the troughs of the prices together on a chart.
Drawing a symmetrical triangle pattern involves combining these components of the converging declining resistance level and the rising support line together.
Types Of Symmetrical Triangle
There are two types of symmetrical triangle chart patterns. The two types are:
- Bullish symmetrical triangle: A bullish symmetrical triangle pattern is a pattern that forms on a price chart of a financial market and signals that the price may increase and trend higher. A buy entry point occurs when the price breaks out of the resistance level of the pattern. It is only considered a bullish symmetrical triangle if the price breaks out of the pattern to the upside.
- Bearish symmetrical triangle: A bearish symmetrical triangle pattern is a pattern that forms on the price charts of a financial market and signals that the price may decrease and trend lower. A short entry point occurs when the price breaks down below the support level of the pattern. It is only considered a bearish symmetrical triangle if the price breaks down from the pattern to the downside.
Symmetrical Triangle Chart Pattern Examples
Below are visual examples of symmetrical triangle chart patterns.
Example Of A Bullish Symmetrical Triangle Chart Pattern
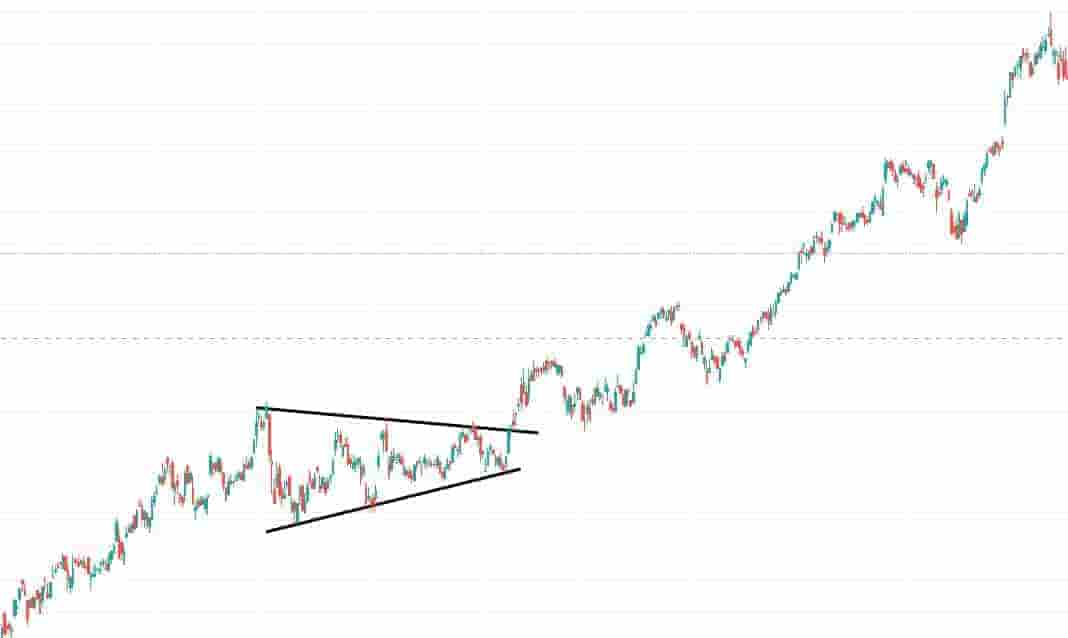
In the above price chart of Amazon stock, a bullish symmetrical triangle chart pattern forms.
It is known as a bullish symmetrical triangle pattern because the price trend preceding the breakout was bullish and the prices increased.
The bullish symmetrical triangle forms when the price rises in a bullish uptrend and then consolidates making lower highs and higher lows in the prices.
The price breaks out to the upside and this leads to a bullish trend in the price.
Example Of A Bearish Symmetrical Triangle Chart Pattern
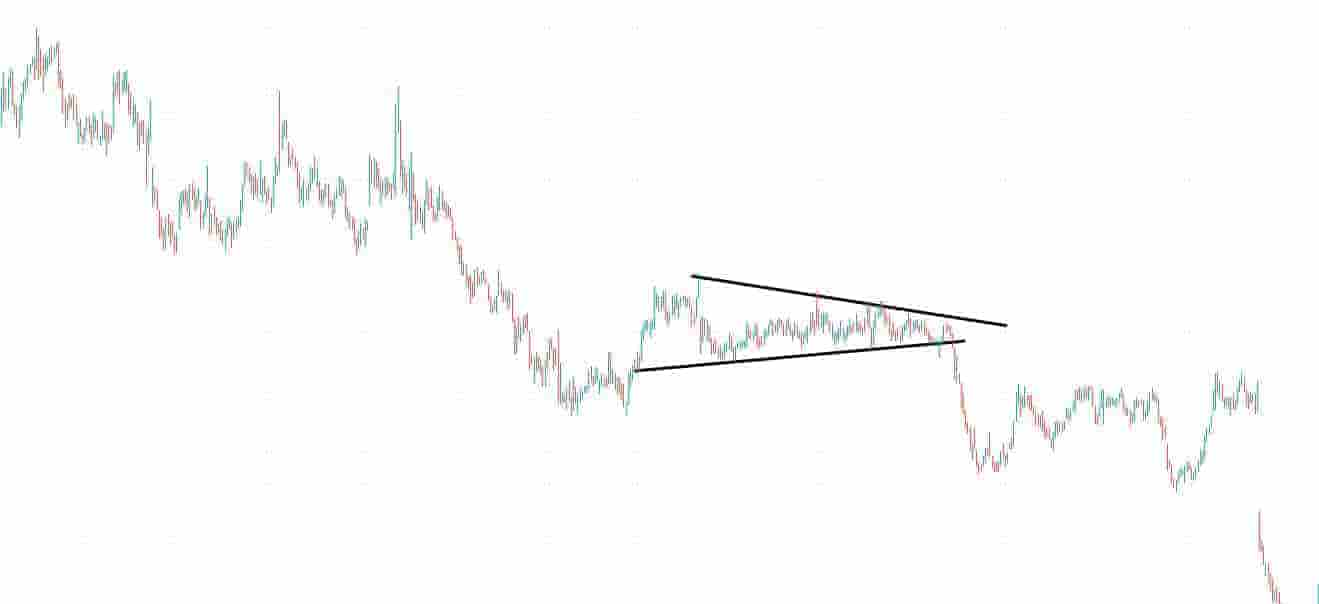
In the Groupon price chart above, a bearish symmetrical triangle forms.
It is known as a bearish symmetrical triangle pattern because the price trend preceding the breakout was bearish and the prices decreased.
The bearish symmetrical triangle forms when the price declines in a bearish downtrend and then consolidates making lower highs and higher lows in the prices.
The price breaks down to the downside and this leads to a bearish trend in the price.
Example Of A Symmetrical Triangle Pattern As A Continuation Pattern
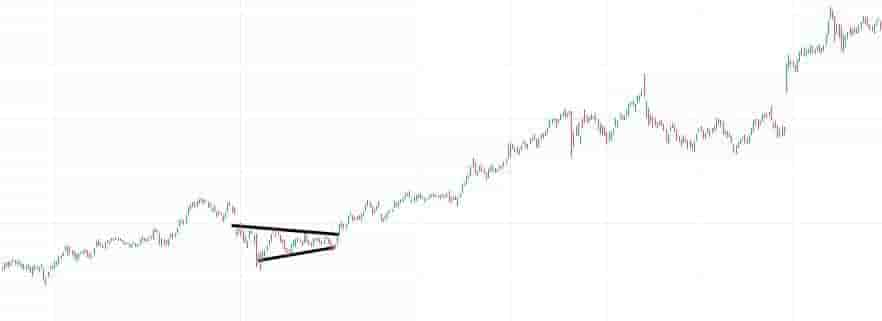
In the price chart of Amazon stock above, a continuation bullish symmetrical triangle formed.
It is known as a continuation bullish symmetrical triangle pattern because it formed during a bullish price trend and lead to a continuation in the bullish trend.
Example Of A Symmetrical Triangle Pattern As A Price Reversal Pattern
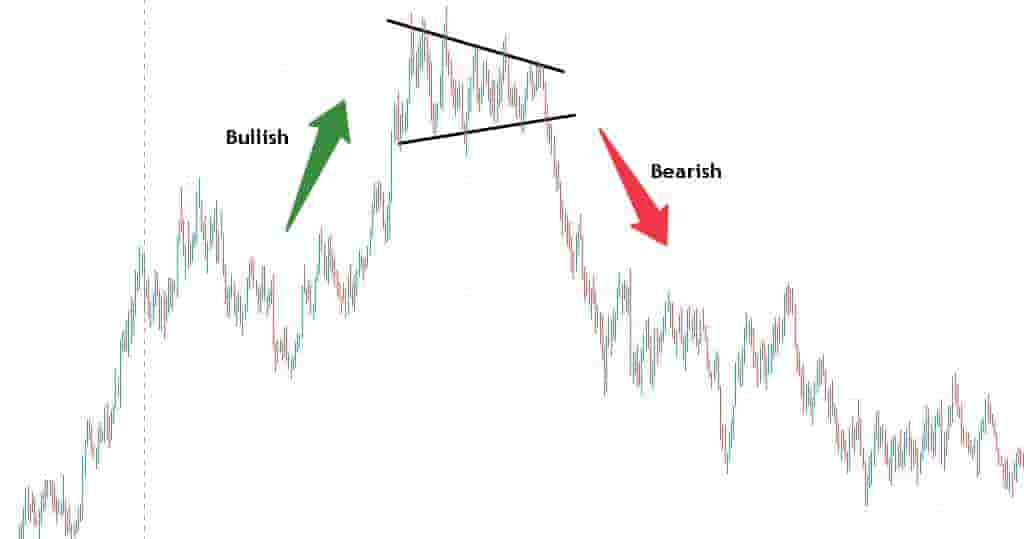
In the above price chart of EUR/USD currency pair, a reversal symmetrical triangle forms that signals a price reversal from a bullish trend to a bearish trend.
The price runs up, consolidates and then breaks down. This is an example of a reversal symmetrical triangle pattern.
It is known as a reversal symmetrical triangle pattern because it formed after a price trend in one direction and the price reversed to another direction.
Symmetrical Triangle Pattern Timeframes
A symmetrical triangle chart pattern can be traded on any timeframe it forms on without any restrictions.
Popular timeframes that traders use to trade the symmetrical triangle chart pattern are:
- 5-minute price charts: Scalpers and high-frequency traders will use the 5-minute price chart to find and trade the symmetrical triangle chart pattern.
- 1-hour price charts: Day traders will use the hourly price charts to find symmetrical triangles in the market.
- Daily price charts: Swing traders will use daily price charts to find and trade symmetrical triangles.
- Weekly price charts: Longer-term traders will use the weekly price charts to find and trade the symmetrical triangle pattern.
How To Find Symmetrical Triangle Patterns
The methods for finding symmetrical triangle chart patterns are:
- Browsing through charts manually: Many traders prefer to manually browse through the price charts of markets and manually find and draw these patterns on their own charts.
- Using a symmetrical triangle chart pattern scanner: Traders can use chart pattern scanning software to help them find these patterns in the market.
Symmetrical Triangle Benefits
The benefits of the symmetrical triangle chart pattern are:
- It's easy to understand: New traders can easily learn how to spot this pattern as it's only two lines of drawing and is not difficult to find in the market.
- It can help find both buying and shorting signals: This pattern can be used for bullish and bearish signals and is not restricted to just one direction.
- It can be used on any timeframe and in any market: This pattern can be used in any market and can be used on any timeframe of price chart.
Symmetrical Triangle Pattern Limitations
The limitations of the symmetrical triangle chart pattern are:
- It can cause confusion: A trader can trade this pattern both short and long. This can sometimes cause confusion as to which direction the market price will trend in.
- It can cause many false breakouts: A symmetrical triangle can be traded both long and short. It can offer many false breakouts before the real move occurs. This can frustrate trades as they attempt to capture the real breakout.
Symmetrical Triangle Formation Duration
The duration of time a symmetrical triangle pattern will take to form depends on the timeframe of the price chart.
Popular examples of how long a symmetrical triangle pattern takes to form include:
- 20 minutes minimum on a 1-minute price chart: A symmetrical triangle typically takes 20 minutes or more to form on a 1-minute price chart.
- 20 - 30 hours on an hourly price chart: A symmetrical triangle typically takes between 20 to 30 hours minimum to form on an hourly price chart.
- 30 - 40 days on a daily price chart: A symmetrical triangle takes a minimum of 30 to 40 days to form on a daily price chart.
- 20 - 30 weeks on a weekly price chart: A symmetrical triangle takes a minimum of 20 to 30 weeks to form on a weekly chart.
Frequently Asked Questions About The Symmetrical Triangle Pattern
Below are frequently asked questions about the symmetrical triangle chart pattern.
Is A Symmetrical Triangle Pattern A Bullish Or Bearish Signal?
A symmetrical triangle pattern can be both a bullish or bearish signal. This will depend on what direction the price breaks out of the pattern.
If the price of a market breaks out of the declining resistance level of the pattern, it is a bullish signal. If the price of the market breaks down below the rising support level of the pattern, it is a bearish signal.
Where Is The Buy Entry Point Of A Symmetrical Triangle Pattern?
The buy entry point of a symmetrical triangle chart pattern is when the price breaks out above the declining resistance level. Typically, a trader will like to see an increase in buying pressure and buying volume at the breakout point.
Where Is The Short Entry Point Of A Symmetrical Triangle Pattern?
The short entry point of a symmetrical triangle chart pattern is when the price breaks down below the rising support level. Typically, a trader will like to see an increase in selling pressure and selling volume at the breakdown point.
What's The Difference Between A Symmetrical Triangle Pattern And A Descending Triangle Pattern?
The differences between a symmetrical triangle chart pattern and a descending triangle chart pattern are:
- It's shape: A symmetrical triangle and a descending triangle are shaped differently. A symmetrical triangle connects converging support and resistance levels whereas a descending triangle has a horizontal support level and a declining resistance level.
- What it signals: A symmetrical triangle can signal both a buying or short trigger whereas a descending triangle will only signal a shorting signal.
What's The Difference Between A Symmetrical Triangle Pattern And An Ascending Triangle Pattern?
The differences between a symmetrical triangle and an ascending triangle pattern are:
- It's shape: A symmetrical triangle connects converging trendlines whereas an ascending triangle has a horizontal resistance level and a rising support level.
- What it signals: A symmetrical triangle signals potential future bullish or bearish price trends whereas an ascending triangle signals only future bullish prices.
What Are Symmetrical Triangle Pattern Alternatives?
Symmetrical triangle pattern alternatives are below.
- Ascending triangle pattern
- Bullish flag
- Bearish flag
- Cup and handle
- Descending triangle pattern
- Inverse head with shoulders pattern
- Head with shoulders pattern
- Triple top pattern
- Triple bottom chart pattern
- Breakaway gap chart pattern
- Rising wedge chart pattern
- Falling wedge chart pattern
- Channel patterns
- Bump and run reversals
