What Is A Triple Bottom Chart Pattern?
In technical analysis, a triple bottom is a bullish reversal chart pattern that forms on the price charts of financial markets. It consists of 3 swing low levels in the price and it signals that a bearish trend may be ending and the price may reverse to a new bullish trend.
A triple bottom pattern typically forms at the end of a bearish trend or market bottom. The pattern is completed when the price breaks out above the resistance level, also known as the "neckline" area.
A triple bottom pattern can form in any market with historical price data.
Triple Bottom Pattern Components
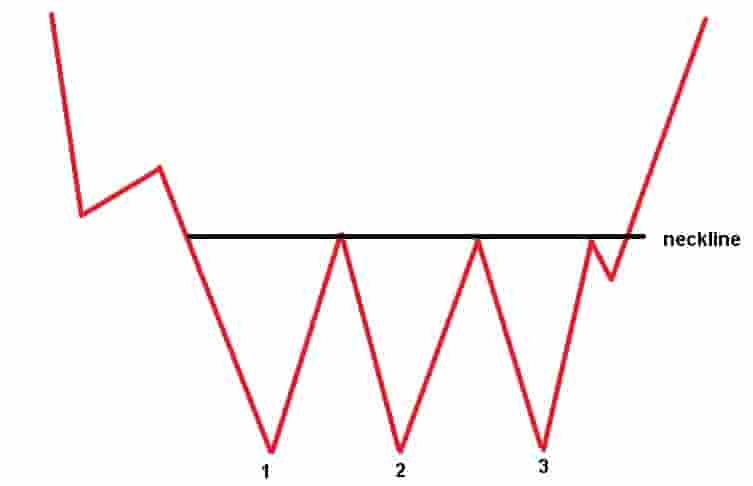
In order to identify a triple bottom pattern, there are a number of components that need to be visible on the price chart.
The four components of a triple bottom pattern are:
- A swing low support level on the left: This is the first swing low level of the triple bottom pattern. It forms on the left side of the pattern. It is labeled "1" on the chart above.
- A swing low support level in the center: This is the second swing low level of the triple bottom pattern. It forms in the center of the pattern and it is the same swing low price level as the first swing low level. It is labeled "2" on the chart above.
- A swing low support level on the right: This is the third swing low level of the triple bottom pattern. It forms on the right side of the pattern and is the same swing low price level as the first and second swing lows. This is the area where a trader will place a stop-loss order when trading this pattern. It is labeled "3" on the chart above.
- A neckline resistance level: This is the swing high resistance level before the price pushes down into the 3 swing low support levels. It is labeled "neckline" on the chart above. It is at this area where a trader will enter a buying position after the price breaks out through the resistance level.
Drawing a triple bottom pattern involves including all these four components together.
Triple Bottom Chart Pattern Examples
Below are visual examples of the triple bottom chart pattern.
Example Of A Triple Bottom Pattern In The Stock Market
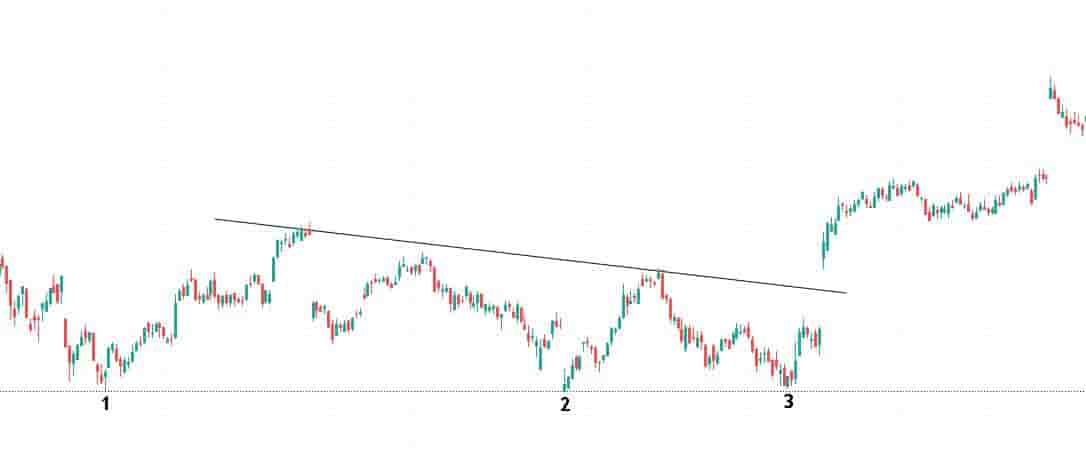
In the daily price chart of Amazon stock, a triple bottom pattern formed. The price of Amazon stock marked 3 clear levels of support in the price.
The price reversed and moved much higher in a bullish trend as evident from the chart above.
Example Of A Triple Bottom Pattern In The Forex Market
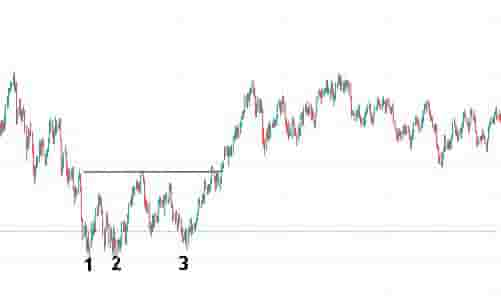
In the daily price chart of the AUD/USD currency pair, a triple bottom pattern formed.
The price of the currency pair made 3 prominent swing low levels in the price before reversing and moving much higher.
Example Of A Triple Bottom Pattern On A Shorter Timeframe Price Chart
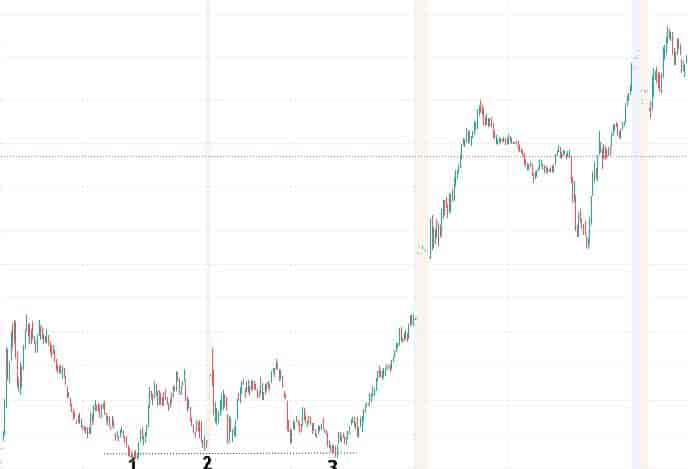
In the 3-minute price chart of Facebook stock, a triple bottom pattern formed.
The price of Facebook stock breaks out after forming the pattern and it leads to a large and fast increase in the price of the stock.
This is an example of a triple bottom pattern forming on a shorter timeframe 3-minute price chart.
Example Of A Triple Bottom Pattern On A Higher Timeframe Price Chart
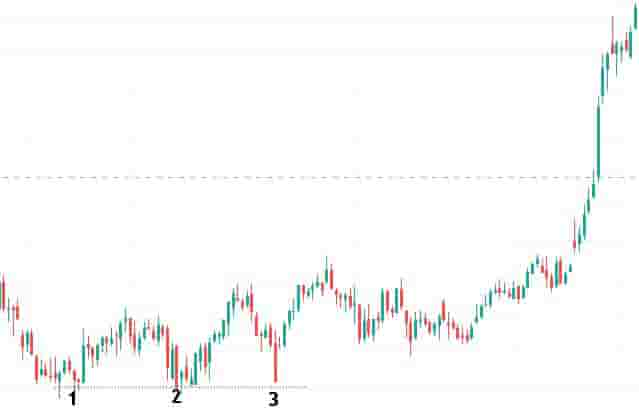
In the weekly price chart of Tesla stock above, a triple bottom pattern formed. It resulted in a very large bullish trend to the upside once the price breaks out.
Tesla stock formed three clear swing low levels, marked 1, 2 and 3 on the chart above.
This is an example of a triple bottom pattern forming on a higher timeframe weekly price chart.
How To Find Triple Bottom Patterns
The methods for finding triple bottom patterns in the markets are:
- Scan price charts manually: A trader can manually browse through the price charts of markets to find triple bottom patterns.
- Use a triple bottom scanner: Traders can use a triple bottom chart pattern scanner to automatically scan for these patterns.
- Follow a chart pattern newsletter: Traders can use chart pattern newsletters to help them find triple bottom patterns in the markets.
Triple Bottom Pattern Benefits
The benefits of triple bottom patterns are:
- It helps to capture large bullish trends: A triple bottom pattern can help a trader to find and trade new bullish trends in the market right from the beginning of the new bullish trend and rising prices.
- It's easy to learn: New traders learn how to spot the triple bottom pattern quickly as it only consists of four components and is easy to see on a price chart.
- It works on any timeframe: A triple bottom pattern can be found and traded on any timeframe price chart and is not limited to just one or a few.
- It can be used in any market: A triple bottom pattern can be applied to any financial market and is not limited to just one market or a few.
Triple Bottom Pattern Limitations
The limitations of triple bottom patterns are:
- It can fail: A triple bottom pattern can and will fail from time to time. This is the same for any chart pattern and should be expected.
- Wide stop-loss: The gap between the entry price and the stop-loss level can be quite high which means there can be a higher risk when trading this pattern.
Triple Bottom Formation Duration
The length of time triple bottom patterns take to form will depend on the timeframe of the price chart used.
Example durations for a triple bottom pattern to form include:
- 90 minutes minimum for a triple bottom pattern to form on a 3-minute price chart.
- 90 hours minimum for a triple bottom pattern to form on a 30-minute price chart.
- 60 days minimum for a triple bottom pattern to form on a daily price chart.
- 60 weeks minimum for a triple bottom pattern to form on a weekly price chart.
Frequently Asked Questions About The Triple Bottom Pattern
Below are frequently asked questions about the triple bottom chart pattern.
Is A Triple Bottom Bearish?
No. A triple bottom pattern is a bullish reversal signal in the market where it forms. It indicates that the price of a market may reverse from bearish price action to bullish price action.
What's The Opposite Of a Triple Bottom Pattern?
The triple bottom pattern's opposite is the triple top pattern.
Is A Triple Bottom Pattern A Reversal Or A Continuation Pattern?
A triple bottom pattern is a reversal chart pattern that signals that the price will reverse from a bearish trend to a bullish trend.
What Price Chart Timeframes Can A Triple Bottom Pattern Form On?
A triple bottom pattern can form on any timeframe price chart from 1-minute, 5-minute, 30-minute and hourly price charts to higher timeframe daily, weekly and monthly price charts.
What Is The Difference Between A Triple Bottom And A Double Bottom Pattern?
The differences between a double bottom price pattern and a triple bottom pattern are:
- It's shape: A double bottom pattern is shaped like the letter "W" with two swing low price levels whereas a triple bottom pattern has three swing low price levels.
- Length of time to form: A double bottom pattern will take less time to form as there are fewer components whereas a triple bottom pattern will take longer to form as there are more components.
