What Is a Continuation Pattern?
A continuation pattern is a pattern that signals the market price will continue to move in the direction of an already-established price trend after a breakout from the pattern breakout point. Continuation patterns form in the intermediate (middle) part of a price trend. A bullish continuation pattern is a pattern that signals the upward trend will continue in a bullish direction after a price breakout and a bearish continuation pattern is a pattern that signals the downward trend will continue in a bearish direction after a price breakdown.
Continuation Pattern Types
Continuation pattern types are triangles, flags, pennants, continuation gaps, and rectangles. Bullish continuation patterns are ascending triangles, bull flags, bullish pennants, bullish continuation gaps, bullish cup and handle patterns, and bullish rectangles. Bearish continuation patterns are descending triangles, bear flags, bearish pennants, bearish continuation gaps, and bearish rectangles.
Flag Patterns
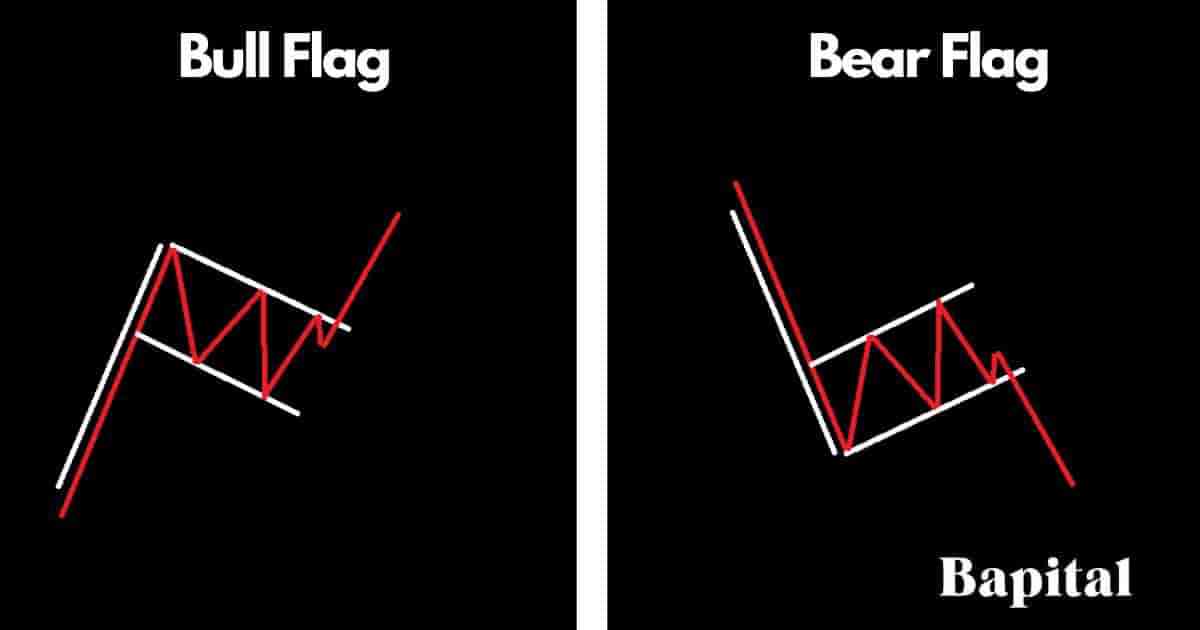
Flag patterns are continuation chart patterns that form in the financial markets and they include the bull flag pattern and the bear flag pattern. These flag patterns signal a potential continuation of the prevailing trend with a bull flag pattern indicating further bullish uptrends in price after a period of price consolidation and a bear flag indicating further declining prices after a period of consolidation or increased volatility.
Flag patterns are categorized by a flagpole connected with two parallel lines with the price oscillating within these parallel levels.
Pennant Patterns
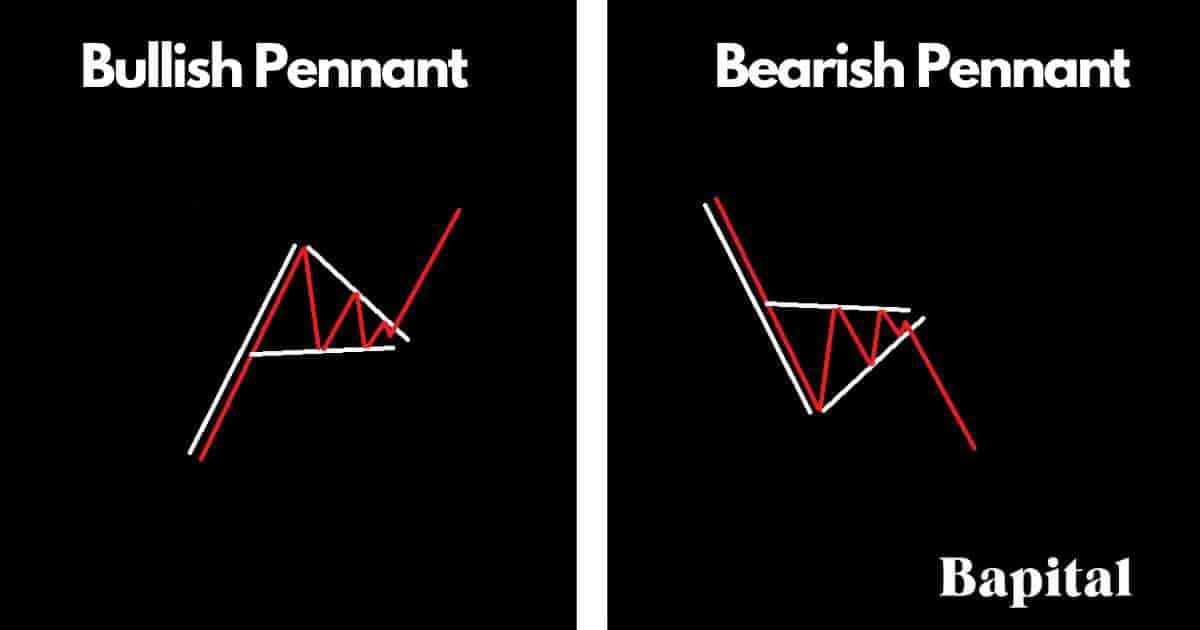
Pennant patterns are continuation patterns that form in financial securities and they include both bullish pennants that form in uptrends and bearish pennants that form in downtrends. A pennant pattern is similar to a flag pattern with the only difference being that pennant patterns have converging support and resistance trendlines while a flag pattern has parallel support and resistance lines.
Triangle Patterns
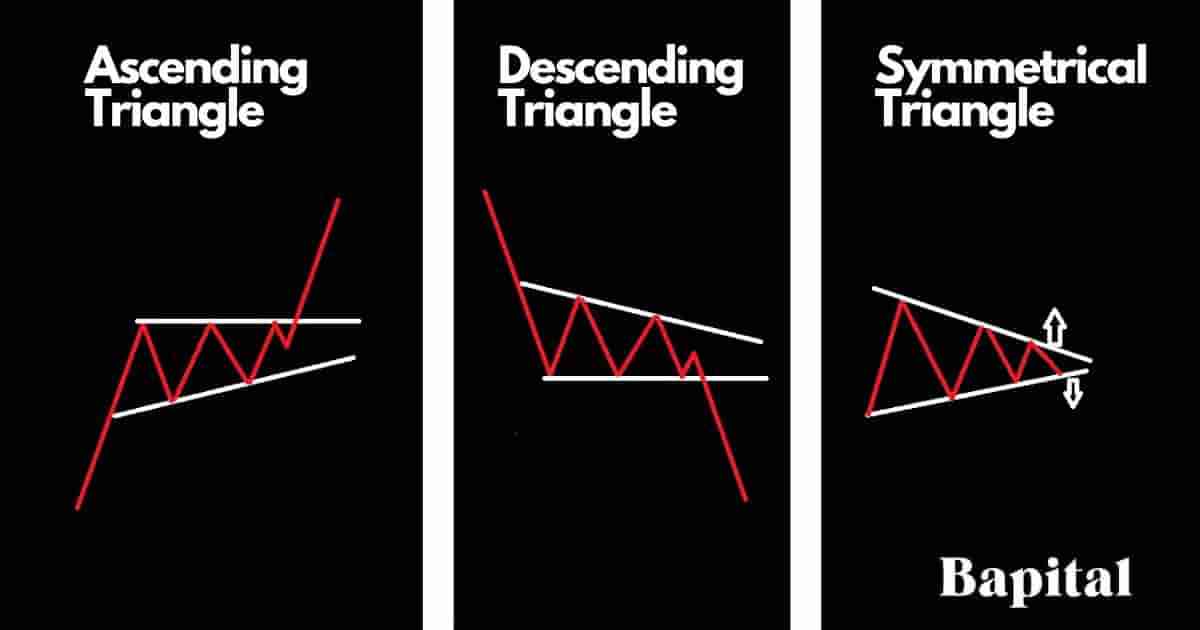
Triangle patterns are defined as continuation patterns that form in financial markets and they include the ascending triangle, the descending triangle, and the symmetrical triangle. The ascending triangle pattern is a bullish continuation chart pattern. The descending triangle pattern is a bearish continuation chart pattern and the symmetrical triangle pattern can be either a bullish or bearish continuation pattern depending on if it forms in an uptrend or downtrend. Triangles are characterized by two trendlines with a trendline connected by swing high prices and another trendline connected to swing low prices.
Cup and Handle Patterns
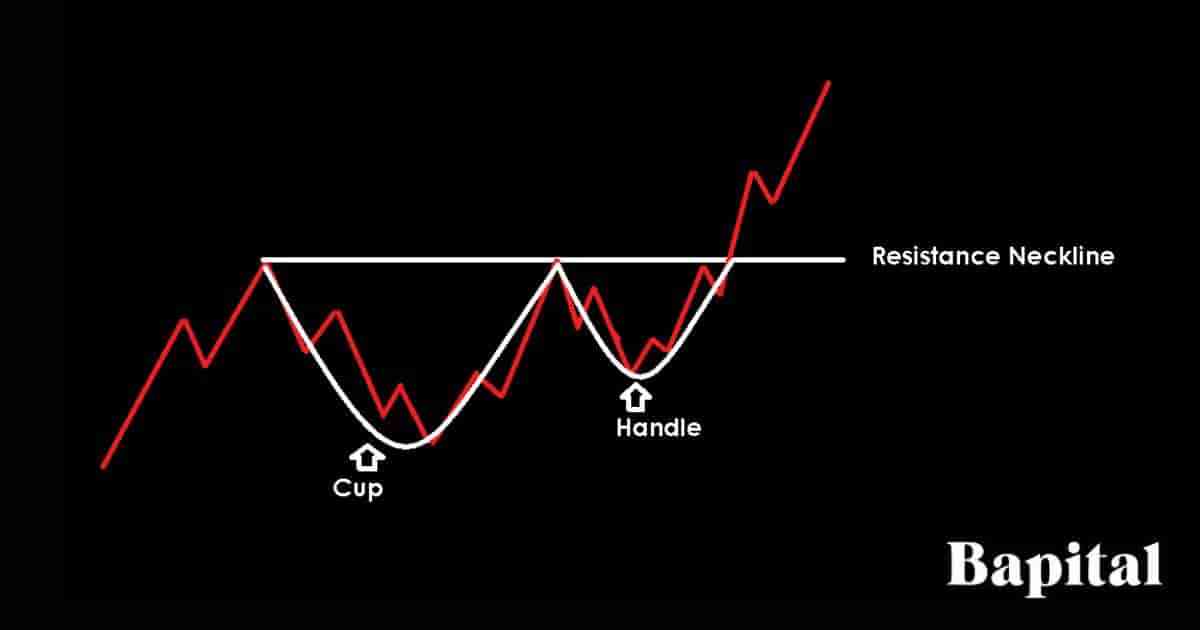
Cup and handle patterns are continuation patterns that signal continued bullish price trends after a breakout from the continuation pattern resistance level. A cup and handle pattern is shaped like a cup with a corresponding handle and is characterized by a large U shape for the cup component followed by a smaller U shape for the handle component.
Continuation Gap Patterns
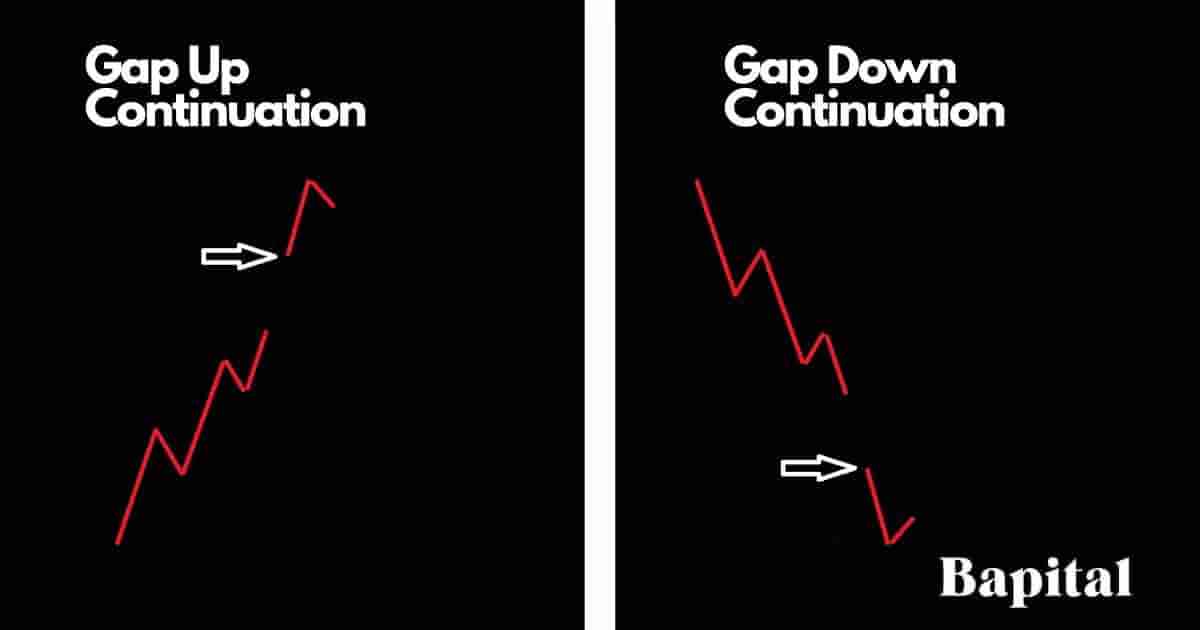
A continuation gap pattern is a continuation pattern that forms when market price gaps up or gaps down in the middle of an already established price trend and continues to trend in the direction of the underlying trend. There are two continuation gap patterns, a bullish continuation gap and a bearish continuation gap. A bullish continuation gap signals a continuation of the increasing price uptrend and a bearish continuation gap signals a continuation of the decreasing price downtrend.
Rectangle Patterns
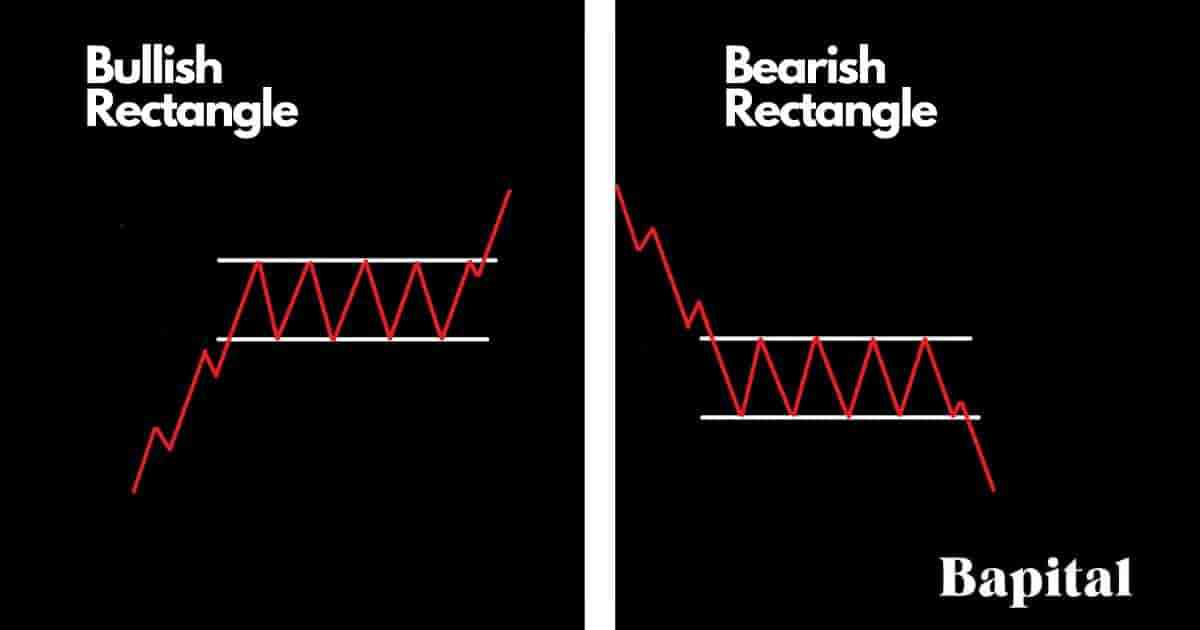
A rectangle pattern is a continuation pattern that forms in the middle of a trend when the price pauses and moves within a sideways narrow range with a clear horizontal support price level and horizontal resistance price level. A rectangle chart pattern can be a bullish rectangle pattern which indicates further price increases in an upward direction or a bearish rectangle pattern which indicates further price decreases in a downward direction.
The rectangle pattern is categorized by two parallel horizontal lines with the price oscillating within a small range where buyers and sellers converge.
How To Trade Continuation Patterns
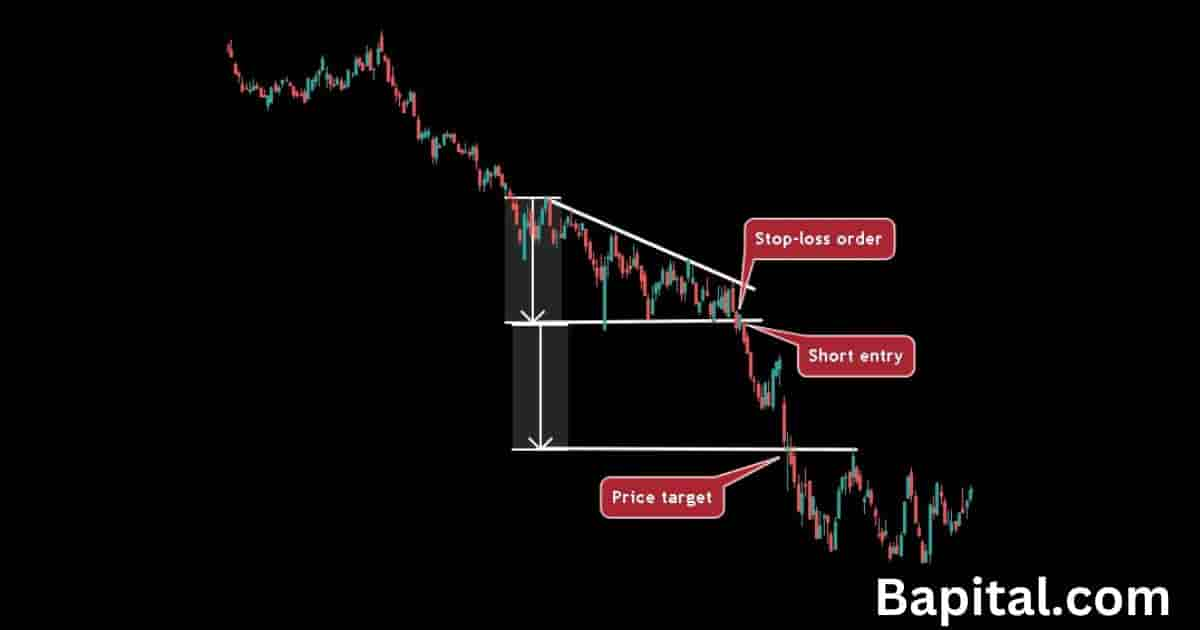
The continuation pattern trading steps are below.
- Wait for the continuation pattern to form after a pause of a strong trending market
- Entry a trade position when the asset price breaks out of the pattern
- Set a price target by measuring the height of the pattern and adding or subtracting this number to the buy entry price/short entry price
- Place a stop loss order below or above the price breakout candlestick or the swing high level/swing low level of the pattern
Continuation Pattern Entry Point
A continuation pattern entry point is set on a bearish continuation pattern when the price penetrates the pattern support level on increased selling volume and bearish momentum. A continuation pattern entry point is set on a bullish continuation pattern when the price rises above the resistance point on increased buying volume and bullish momentum.
Continuation Pattern Price Target
A continuation pattern price target is set by measuring the height of the pattern between the pattern swing low support price and the swing high resistance price and adding or subtracting this measurement to the buy entry price/short entry price.
A bullish continuation pattern price target example is if the buy entry price is $50 and the pattern height is $10, the profit target is $60 ($50+$10).
A bearish continuation pattern price target example is if the short entry price of the pattern is $100 and the pattern height is $20, the profit target is $80 ($100-$20).
Continuation Pattern Price Target Formula
The continuation pattern price target formulas are below.
A bullish continuation pattern price target calculation formula is: Bullish Continuation Price Target = Buy Entry Point + Pattern Height.
A bearish continuation pattern price target calculation formula is: Bearish Continuation Price Target = Short Entry Point - Pattern Height.
Continuation Pattern Risk Management
The continuation pattern risk management is set on a bullish continuation pattern by placing a stop-loss order either below the breakout candlestick or below the swing low of the pattern. A continuation pattern risk management is set on a bearish continuation pattern by placing a stop-loss order above the breakdown candlestick high or above the swing high price of the pattern. The risk is set to a maximum of 1% of trading capital. The continuation pattern risk reward ratio is a minimum of 2:1 meaning a reward of $2+ for every $1 risk.
How To Reduce Risk When Trading Continuation Patterns
Continuation pattern trading risk is reduced by trading smaller position sizes, avoiding illiquid markets with low trading volume, and avoiding trading before or during important political and that increases price volatility.
Continuation Pattern Trading Strategy
A continuation pattern trading strategy is to scan U.S. equity markets for stocks up 10%+ in a bullish trend. Watch these stocks for them to form a bullish continuation pattern. Put a 10 exponential moving average overlay on a daily price chart. Wait for a bullish continuation pattern to form after a price consolidation period. Enter a buy trade when the market price breaks out of the pattern's resistance level on increasing volume. Set a trailing stop-loss along the 10EMA. The trade exit occurs when the daily candlestick bar closes below the moving average.
Continuation Pattern Trading Rules
The continuation pattern trading rules are below.
- Risk 1% of trading capital
- Enter buy trade/sell trade after price breakout only
- Avoid trading prior to or during market news events
- Calculate trade entry price, trade exit price, and trade stop loss price prior to entering trade position
- Calculate the trade position size prior to entering trade
Continuation Pattern Examples
Continuation chart pattern examples are illustrated on the price charts of global markets below.
Bullish Continuation Pattern Example
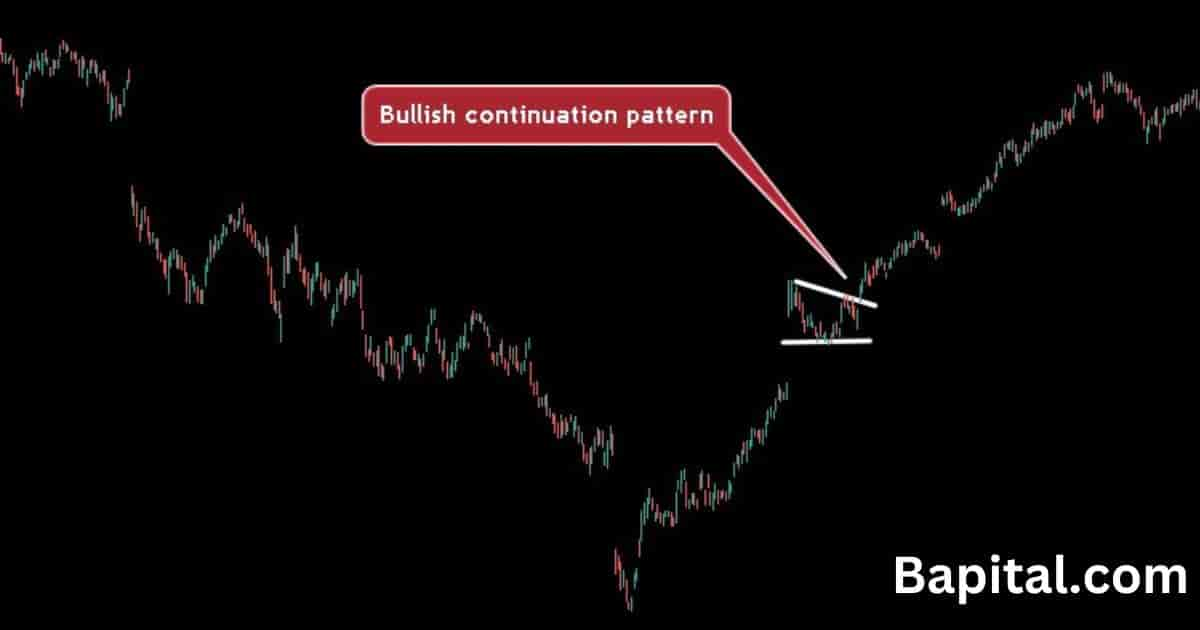
A bullish continuation pattern example is illustrated on the daily Facebook (Meta) stock price chart above. The price of Facebook stock originally trends up in a bullish direction before it pauses and forms a triangle continuation pattern before the price breakout occurs above the chart pattern and the trend continues higher.
Bearish Continuation Pattern Example
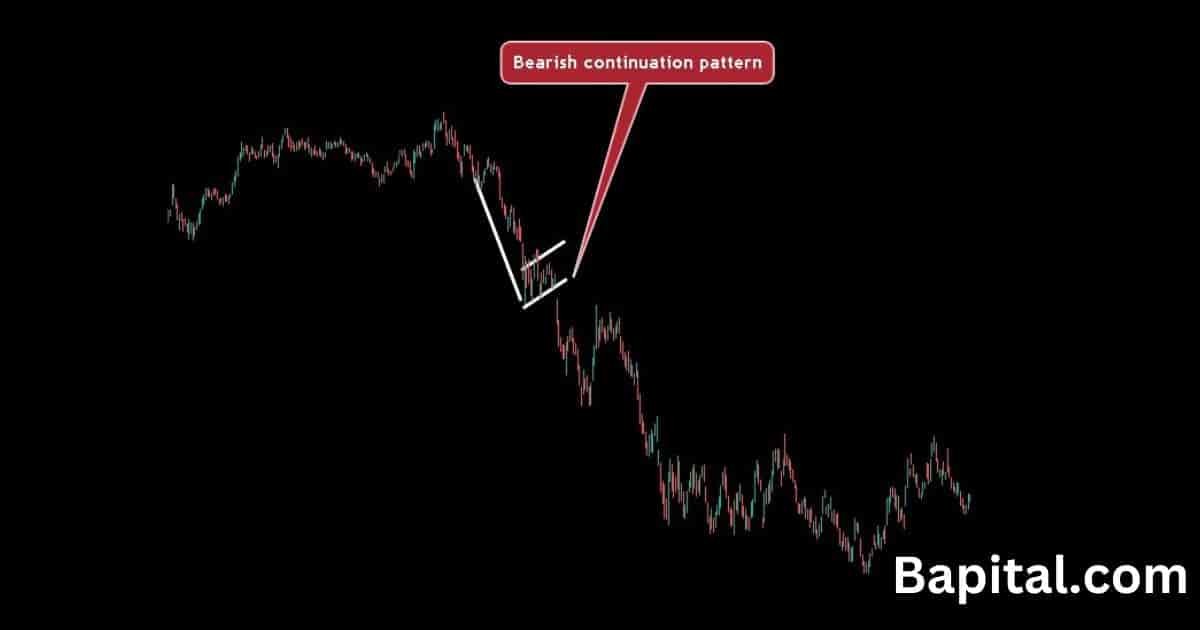
A bearish continuation pattern example is displayed on the daily Shopify (SHOP) stock chart above. The price of Shopify stock originally trends down in a bearish direction before a price pause and bear flag continuation pattern formation. Prices breaks down below the chart pattern support trendline and trends lower.
Continuation Pattern High Timeframe Example
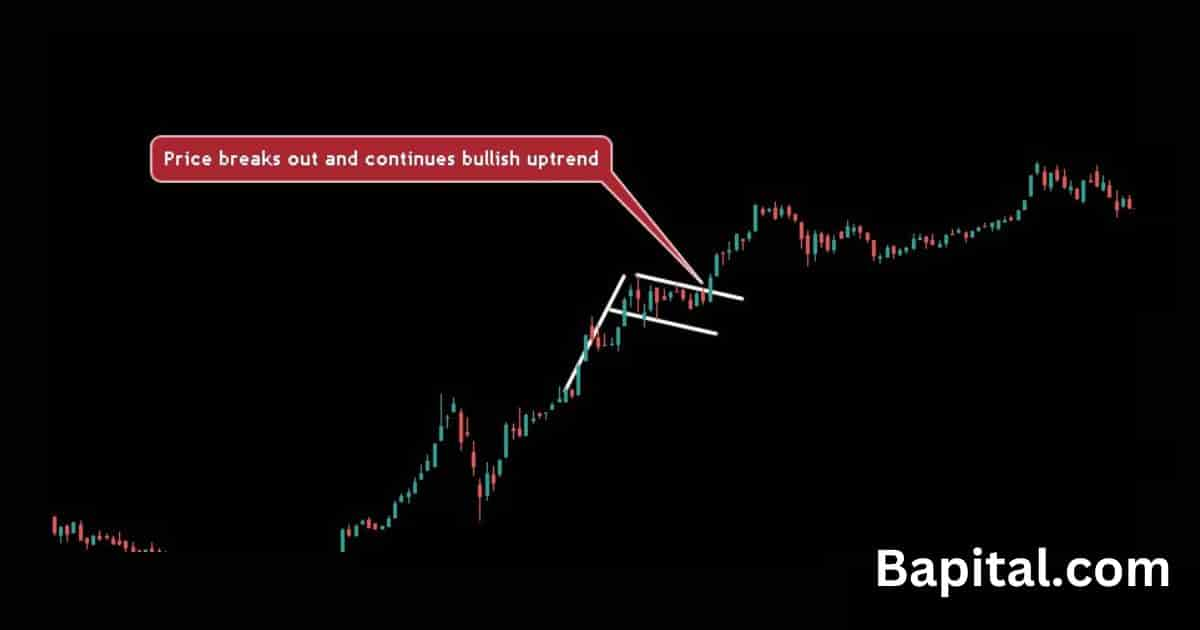
A continuation pattern long timeframe example is shown on the weekly Tesla stock market chart above. Tesla stock price trends higher for months before a price consolidation phase where the continuation pattern forms. A price breakout occurs and this results in the trend continuing upward to the price target and this completes the trade.
Continuation Pattern Short Timeframe Example
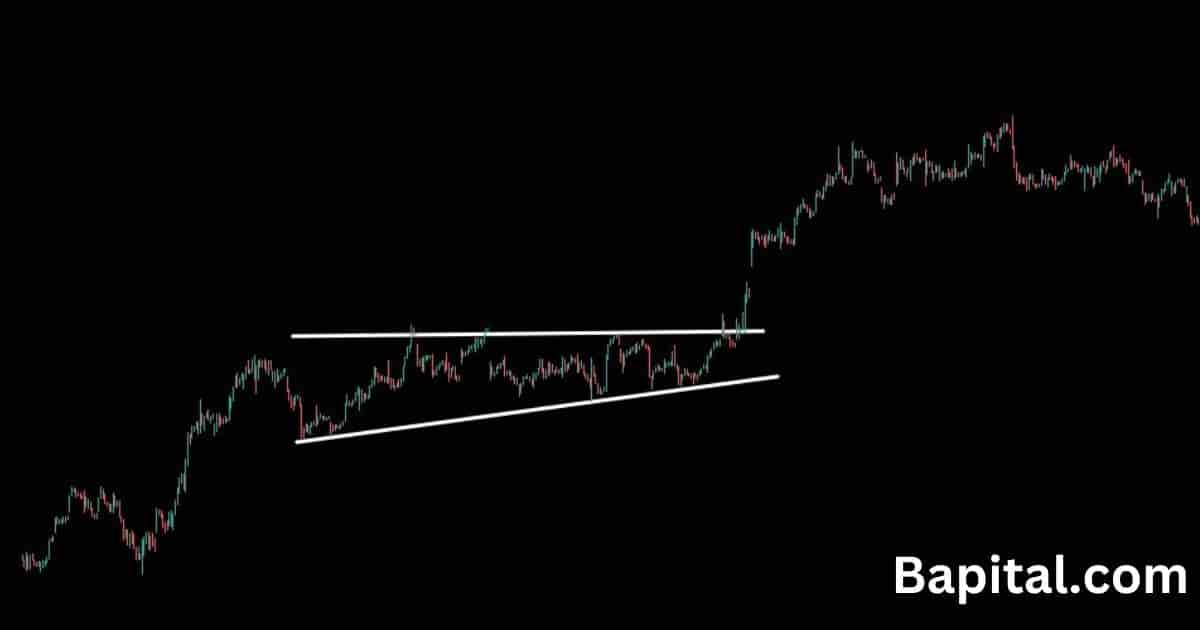
A continuation pattern short timeframe example is shown on the hourly EUR/USD forex chart above. The currency price trends higher for hours before pausing, consolidation, and forming the pattern. The currency pair breaks above the resistance trendline and continues trending upward until it rises to the profit target which completes the trade.
Continuation Pattern Failure
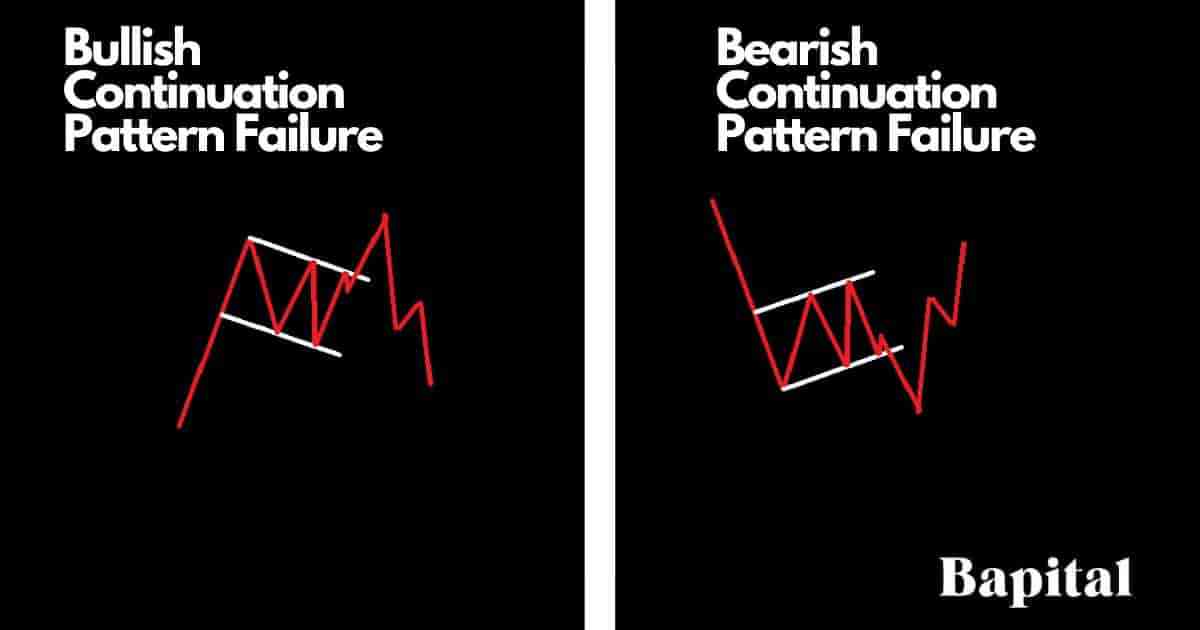
A continuation pattern failure, also known as a "failed continuation pattern", is when the continuation pattern forms and breaks out but fails to continue in the direction of the underlying trend.
The bullish continuation pattern is invalidated and fails when the market security price rises above the resistance breakout buy point but reverses from bullish price action in a upward trend to bearish price action in a downward trend. It is considerd a failure when the price drops from above the breakout point to below the pattern support level.
The bearish continuation pattern is invalidated and fails when the financial market price falls below the support breakdown short point but reverses from bearish price action in a declining trend to bullish price action in a rising trend. It is considered a failure when the price rises from below the breakdown point to above the pattern resistance level.
Continuation Pattern Benefits
The continuation pattern benefits are listed below.
- Provides logic to the price action: Continuation patterns can help traders find a logical structure to the price action in a market as the price breaks out in a continuation trend
- Offers great rewards to risk: A continuation pattern offers great high reward with low risk, typically a reward of $2+ for every $1 risked
- Helps traders join price trends: Continuation patterns help traders enter into a price trend from a low risk entry point where they may missed the initial price movement
- Multiple market application: Continuation patterns form in any market from stocks, commodities, forex, futures, etfs, bonds, equities, and cryptocurrencies. This means they are not restricted to any one market
Continuation Pattern Limitations
The continuation pattern limitations are listed below.
- Hard to find: Newer traders may find it tough to find and identify these chart patterns without using a continuation pattern screener
- Subjective: Continuation patterns are subjective. One trader can see a pattern where another one does not. This can be an issue for traders thinking they spot patterns when in fact it is not clear. This drawback is a particular issue for new traders learning these chart patterns
- False signals: Continuation patterns trigger false signals. Traders need to protect against this by placing stop-loss orders to manage against fakeouts, and false breakouts
These are the main drawbacks of continuation chart patterns that every trader should be aware of.
Continuation Pattern Psychology
The bullish continuation pattern psychology is reflected by strong bullish trends which marks positive sentiment and trader optimism as the price continues higher. The market price begins to consolidate and pause in the middle of the bull trend which highlights market participants feel the price exhausted. During the consolidation phase, traders are cautious as they are unsure of the next trend direction. As the price rallies higher out of the pattern, traders are confident with renewed optimism that the market price will rally much higher.
The bearish continuation pattern psychology is reflected by strong bearish trends which marks negative sentiment and trader pessimism as the price continues lower. The asset price begins to consolidate in the middle of the bear trend which highlights that traders are uncertain about continued falling prices. As the price falls below the pattern support level, traders again lack confidence with renewed bearish sentiment.
Continuation Pattern Frequently Asked Questions
Continuation pattern frequently asked questions are below.
Are Continuation Patterns Used In Technical Analysis or Fundamental Analysis?
Continuation patterns are used in market technical analysis and not fundamental market analysis.
What Is The Most Accurate and Least Accurate Continuation Pattern?
The most accurate continuation pattern is the bull flag pattern with a 63% accuracy rate according to the book, "Encyclopedia of Chart Patterns", by Thomas Bulkowski. The least accurate continuation pattern is the rectangle pattern with a 38% accuracy rate across backtesting data of 2,027 historical examples.
What Are The Most Popular and Least Popular Continuation Patterns?
The most popular continuation patterns are bullish and bearish flags, bull and bear pennants, and triangles. The least popular continuation patterns are rectangles and continuation gaps.
What Continuation Patterns Have The Highest and Lowest Risk/Reward Ratio?
The highest risk/reward ratio continuation pattern is the bullish pennant with a 3.5:1 risk reward ratio and the lowest risk reward ratio continuation pattern is the continuation gap with a 2:1 risk reward ratio.
Is a Continuation Pattern Bullish or Bearish?
A continuation pattern can be either bullish or bearish depending on the type of continuation pattern that forms with a bullish continuation pattern formation being bullish and a bearish continuation pattern formation being bearish.
How Long Do Continuation Patterns Take To Form?
A continuation pattern takes from 1 hour to form on 1 minute timeframe charts to over 60 months on a monthly price chart. The continuation pattern formation duration varies based on the specific chart pattern.
What Timeframes Price Chart Do Continuation Patterns Form On?
Continuation patterns form on any timeframe price chart from short term tick charts to longer-term monthly price charts and yearly price charts.
What Technical Indicators Are Used With Continuation Patterns?
Continuation patterns are used with technical indicators like the volume indicator, R.S.I. oscillator, VWAP, bollinger bands, keltner channels, moving average overlays, and a MACD.
What Type Of Traders Use Continuation Patterns?
Continuation patterns are used by professional day traders, scalpers, swing traders, position traders, longer-term traders, investors, and chartered market technicians (CMT) to make trading and investing decisions.
How Do Traders Find Continuation Patterns?
Continuation pattern formations are found by scanning the financial markets with a continuation pattern charting scanner, checking the online profiles of top traders or expert chartered market technicians (CMT), browsing the market charts manually, or by checking investment broker software.
What Is The Opposite Of Continuation Patterns?
The continuation pattern's opposite is reversal patterns which signal price reversals in the price trend of a market rather than a continuation of the underlying trend.
What's The Difference Between Continuation vs Reversal Patterns?
A continuation pattern's difference with a reversal pattern is a continuation pattern indicates a price trend continuation while a reversal pattern indicates a price trend reversal.
