What Is Technical Analysis?
Technical analysis is a financial security analysis methodology that involves evaluating past market data, primarily price and volume, to forecast future price movements and identify potential trading opportunities. It is based on the belief that historical price patterns and trends tend to repeat themselves, allowing traders to anticipate future price movements based on past market behavior. Technical analysis involves using various tools and techniques, including chart patterns, technical indicators, trendlines, and statistical analysis, to interpret market behavior. The technical analysis abbreviation is TA.
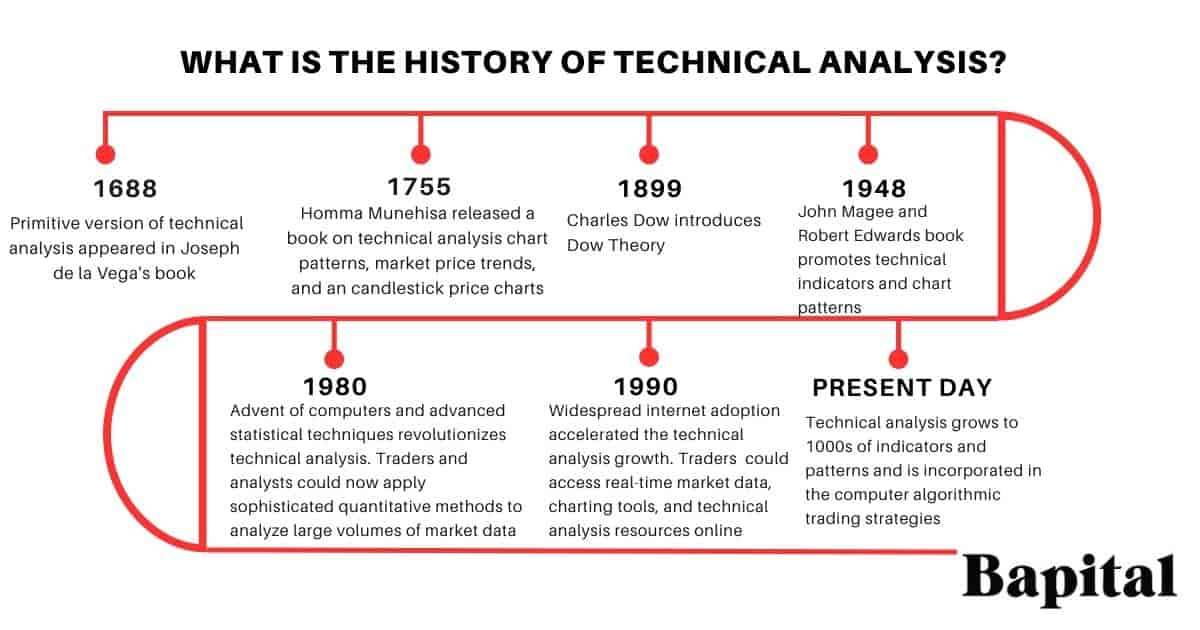
What Is The History Of Technical Analysis?
The technical analysis origins date back to the 17th century when a very primitive version of technical analysis appeared in an Amsterdam-based merchant named Joseph de la Vega's book called "Confusion de Confusiones". This book was released in 1688 and provided insight into the Dutch financial markets by using a very basic technical analysis version to provide such technical insights.
Following the technical analysis origins in 1688, a Japanese rice trader named Homma Munehisa released a book in 1755 called "The Fountain Of Gold-The Three Monkey Record Of Money" which was the first book on technical analysis chart patterns, market price trends, and an introduction to candlestick price charts.
Between the years 1899 to 1902, technical analysis became more popular when Charles Dow, founder of the Wall Street Journal and the Dow Jones Industrial Index, published the Dow theory and modern technical analysis concepts in the Wall Street Journal bringing technical analysis to the masses.
In the early 20th century, printing technology advancements made it easier to produce and distribute price charts. Technical analysts began using charts to visually represent historical price data and identify patterns and trends. The introduction of bar charts and point and figure charts provided traders with powerful tools for analyzing market behavior.
In the 1920s and 1930s after the Dow theory introduction, technical analysis has been promoted in many books by author Richard W. Schabacker.
In 1948, technical analysis was further promoted by authors John Magee and Robert D. Edwards in their book "Technical Analysis of Stock Trends" and it has evolved into many thousand mathematical technical indicators, hundreds of chart patterns, and over thirty candlestick patterns since then.
Throughout the 20th century, market technicians continued to refine and develop new indicators and oscillators to analyze price data and identify potential trading opportunities. Key technical indicators, such as moving averages, relative strength index (RSI), moving average convergence divergence (MACD), volatility, rate of change, volume, and stochastic oscillator became widely used in technical analysis during this time period.
In the latter half of the 20th century, the advent of computers and advanced statistical techniques revolutionized technical analysis. Traders and analysts could now apply sophisticated quantitative methods to analyze large volumes of market data and test trading strategies systematically. This led to the development of algorithmic trading systems and quantitative trading approaches based on technical analysis principles.
In the late 20th and early 21st centuries, financial market globalization and widespread internet adoption accelerated the technical analysis growth. Traders and investors from around the world could access real-time market data, charting tools, and technical analysis resources online, facilitating the dissemination and exchange of technical analysis knowledge and techniques.
In recent years, there has been a growing recognition of the complementary relationship between technical analysis and other forms of analysis, such as fundamental analysis, behavioral finance, and quantitative analysis. Many traders and investors now use a multidisciplinary approach, combining technical analysis with other analytical methods to make more informed investment and trading decisions.
Who Are The Pioneers Of Technical Analysis?
The technical analysis pioneers are Joseph de la Vega, Homma Munehisa, Charles Dow, Richard W. Schabacker, John Magee and Robert D. Edwards.
Joseph de la Vega was a Dutch merchant who in the year 1688 provided the very first technical analysis introduction of Dutch capital markets.
Homma Munehisa was a Japanese rice trader who in the year 1755 introduced technical analysis candlestick charts, chart patterns, and market trend analysis.
Charles Dow was a technical analysis pioneer who published Dow theory between 1899 and 1902 which saw technical analysis increase in popularity.
Richard W. Schabacker promoted technical analysis through his books betwen 1920s and 1930s which helped with technical analysis growth.
John Magee and Robert D. Edwards popularized technical indicators, trend analysis techniques, and technical analysis theory through their book in 1948.
What Are The Principles Of Technical Analysis?
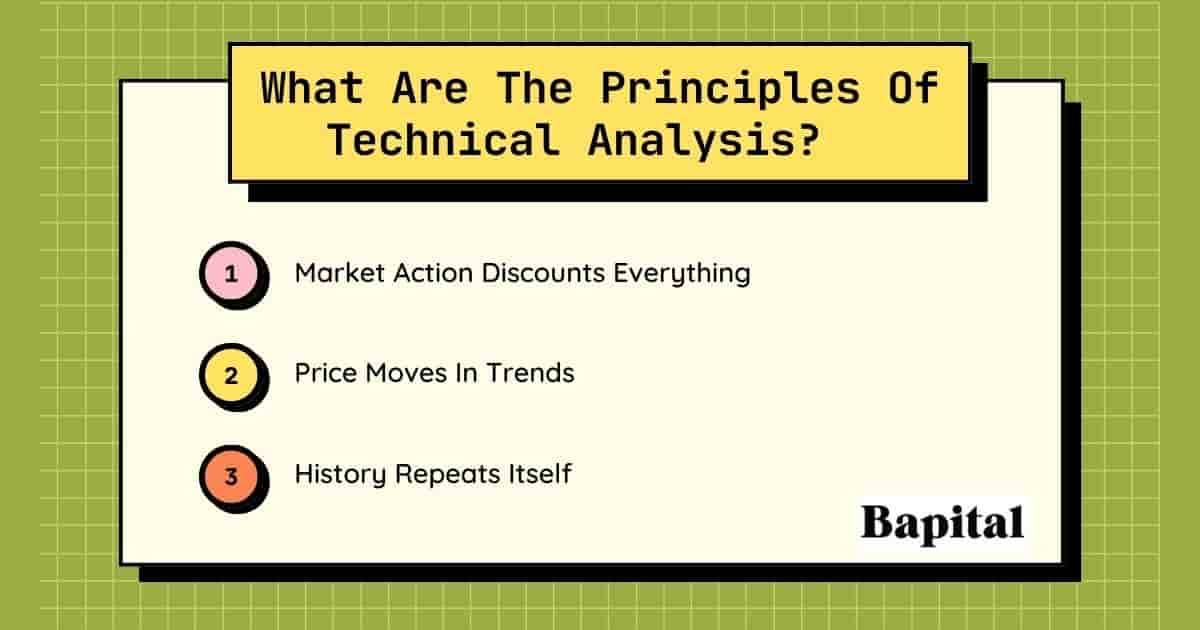
The three technical analysis principles are market action discounts everything, price moves in trends, and history repeats itself.
1. Market Action Discounts Everything
The first technical analysis principle is that market action discounts everything which means that anything that can affect the price including political events, economic events, psychological factors, market sentiment, etc. is already reflected in the price. As a result of this principle, technical traders and technical analysts believe that technical analysis is the only required method of price forecasting and market analysis as everything is already reflected in the price.
2. Price Moves In Trends
The second technical analysis principle is the observation that tradable markets tend to exhibit prolonged periods of directional trending movement. There are three types of trends which are uptrends, downtrends, and sideways trends.
3. History Repeats Itself
The third technical analysis principle is history repeats itself which means that patterns and trends observed in historical price data are likely to occur again in the future. This principle is based on the belief that market participants exhibit consistent behavior over time, leading to the recurrence of similar market dynamics and price movements which enables traders and technical analyst to generate trading signals with the belief that these patterns and repetitive price fluctuations will have a similar outcome in the future.
What Are The Theories Of Technical Analysis?
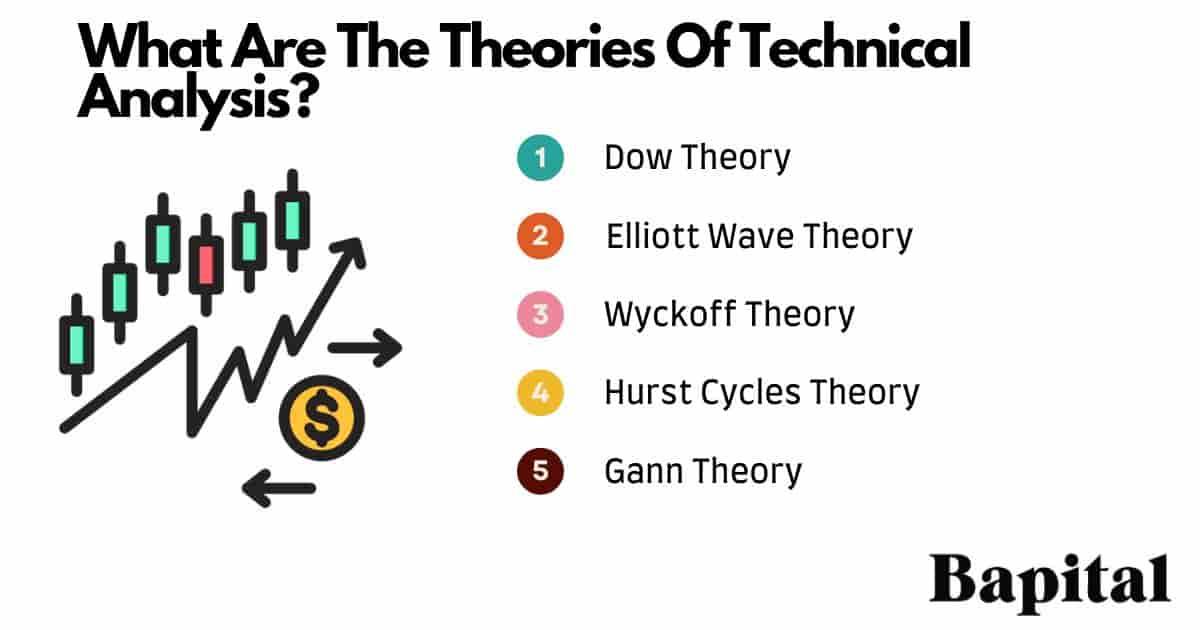
The five technical analysis theories are the dow theory, elliott wave theory, wyckoff theory, hurst cycles theory, and gann theory.
1. Dow Theory
The Dow theory is a theory created by Charles Dow that states that the market is in an uptrend if one of the averages marks a higher high in the price while a higher high is simultaneously created in the other average. It also states that the market is in a downtrend if the market marks a lower low in the price of two averages simultaneously. The Dow Theory's 6 tenents are the market discounts everything, the market has three trends, major trends have 3 phases, the averages must confirm each other, volume must confirm the price trend, and trends continue until a definitive reversal signal.
2. Elliott Wave Theory
Elliott Wave theory, developed by Nelson Elliott, is a form of technical analysis theory that states that the price of financial markets moves in two wave patterns in the longer term which are impulse waves and corrective waves.
3. Wyckoff Theory
The Wyckoff theory, developed by Richard Wyckoff, is a theory that outlines the various key elements in the market cycle of a financial market. Wyckoff theory categorizes market cycles into 4 different market periods or phases including accumulation phase, markup phase, distribution phase, and markdown phase. Wyckoff theory has three main laws which are the law of effort, the law of cause and effort, and the law of supply and demand
4. Hurst Cycles Theory
Hurst cycles theory is a technical analysis theory developed by JM Hurst that provides a road-map of recurring trend changes at all time frames within financial markets. Hurst cycles theory consists of 8 principles which are the principle of cyclicality, the principle of commonality, the principle of summation, the principle of harmonicity, the principle of synchronicity, the principle of proportionality, the principle of nominality, and the principle of variation.
5. Gann Theory
Gann theory is a technical analysis theory developed by William D. Gann that states that the prices of financial markets move in various different angles and the price changes in financial markets are related to geometry. Gann angles are based on the 45-degree angle, also known as the 1:1 angle. The most common gann angles used are 2:1, 3:1, 4:1, 8:1, 16:1, 1:4, and 1:8.
What Are The Components Of Technical Analysis?
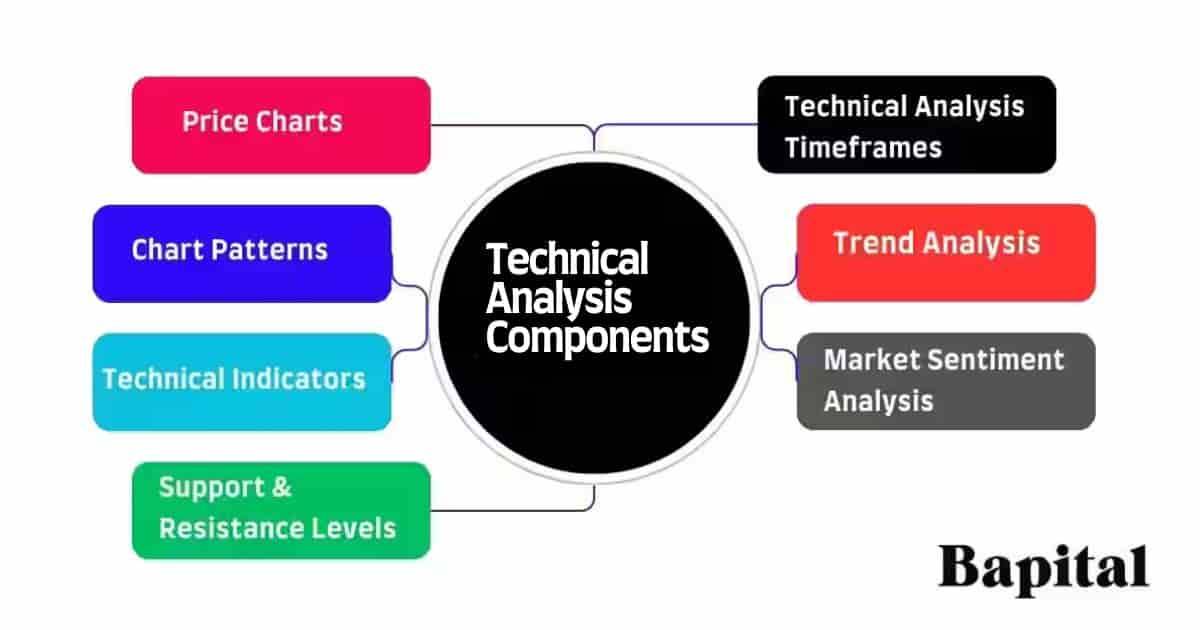
The technical analysis components are price charts, chart patterns, technical indicators, trend analysis, market sentiment analysis, support and resistance levels, and timeframe analysis.
1. Price Charts
Price charts in technical analysis are graphical representations of a financial instrument's historical price movements over a specific period of time. The price charts are fundamental tools used by market participants to identify trends, patterns, support and resistance levels, and other important aspects of market behavior.
What Are The Types Of Price Charts?
The types of price charts used in technical analysis are line charts, point and figure charts, candlestick charts, bar charts, area charts, heiken ashi charts, renko charts, and kagi charts.
- Line Charts: Line charts consist of a line that connects closing prices over a specified time period. Each data point on the chart represents the closing price of the security. Line charts provide a clear visual representation of the overall trend but may lack detail like the open price, high price and low price compared to other chart types
- Bar Charts: Bar charts display price movements using vertical bars. Each bar represents a specific time period (such as a day, week, or month) and contains four price points: the open, high, low, and close prices for that period. The opening price is represented by a horizontal line on the left side of the bar, while the closing price is represented by a horizontal line on the right side. The high and low prices are indicated by the top and bottom of the vertical bar. Bar charts provide more detail than line charts and are useful for analyzing price volatility and the range of price movements within each period
- Candlestick Charts: Candlestick charts use candlestick-shaped symbols to represent price movements. Each candlestick contains the same four price points as a bar chart: the open, high, low, and price close for the time period. The body of the candlestick (the rectangular area between the open and close prices) is filled or hollow, depending on whether the closing price is higher or lower than the opening price. Candlestick colors (often green for bullish candles and red for bearish candles) can vary depending on the charting software or personal preference. The candlestick charts provide additional visual cues, such as patterns and formations, that can help analysts identify potential trend reversals or continuation patterns
- Point and Figure Charts: Point and figure charts are constructed using columns of X's and O's, representing rising prices and falling prices respectively, focusing solely on price movements and filtering out minor fluctuations
- Area Charts: Area charts represent the area below the line connecting closing prices, giving a visual representation of price movement over time
- Heiken Ashi Charts: Heiken ashi charts are a type of candlestick chart that uses modified candlesticks to filter out market noise and emphasize trends
- Renko Charts: Renko charts are constructed using bricks (boxes) that are placed at 45-degree angles to each other, with the brick's size determined by price movement, ignoring time and focusing solely on price changes
- Kagi Charts: Developed in Japan, Kagi charts use vertical lines to connect prices, emphasizing price movement direction while ignoring insignificant price fluctuations
2. Technical Analysis Timeframes
The technical analysis timeframes are intraday, short term, medium term, and long term timeframes. In technical analysis, timeframes refer to the specific time durations over which price data is analyzed and timeframes can be adjusted on market price charts. Different timeframes are used to suit various trading styles, strategies, and objectives.
Technical analysis timeframes are listed below.
- Intraday: Intraday timeframes are timeframes within a single trading day, such as 1-minute, 5-minute, 15-minute, 30-minute charts, hourly charts, etc. for day trading. Intraday traders focus on short-term price movements and often execute multiple trades within the same trading day. Intraday traders include scalpers and day traders
- Short-Term: Short term timeframes are timeframes ranging from a few days to several weeks, such as the 4-hour, or daily charts for swing trading. Short-term traders aim to capitalize on medium-term price movements and may hold positions for several days to a few weeks. Short term traders are typically swing traders
- Medium-Term: Medium timeframes span several weeks to a few months, typically analyzed using daily or weekly charts. Medium-term traders seek to identify and capitalize on trends that last for several weeks to a few months. Medium term traders include swing traders and position traders
- Long-Term: Long-term timeframes are timeframes extending over several months to several years, often analyzed using weekly or monthly charts. This is known as position trading. Long-term traders focus on fundamental factors and major trends, aiming to hold positions for extended periods. Long term traders include position traders and active investors
- Multi-Timeframe Analysis: Traders and analysts often use multiple timeframes simultaneously to gain a comprehensive view of the market. For example, they may analyze daily charts to identify the overall trend and use shorter-term 10-minute charts for timing trade entries and trade exits
What Are The Most Popular Timeframes In Technical Analysis?
The most popular technical analysis timeframes are 1-minute charts, 5-minute charts, 30-minutes charts, and hourly charts for intraday trading, daily price charts for swing trading, weekly and monthly price charts for position trading, and quarterly and yearly price charts for long-term trading and investing.
3. Chart Patterns
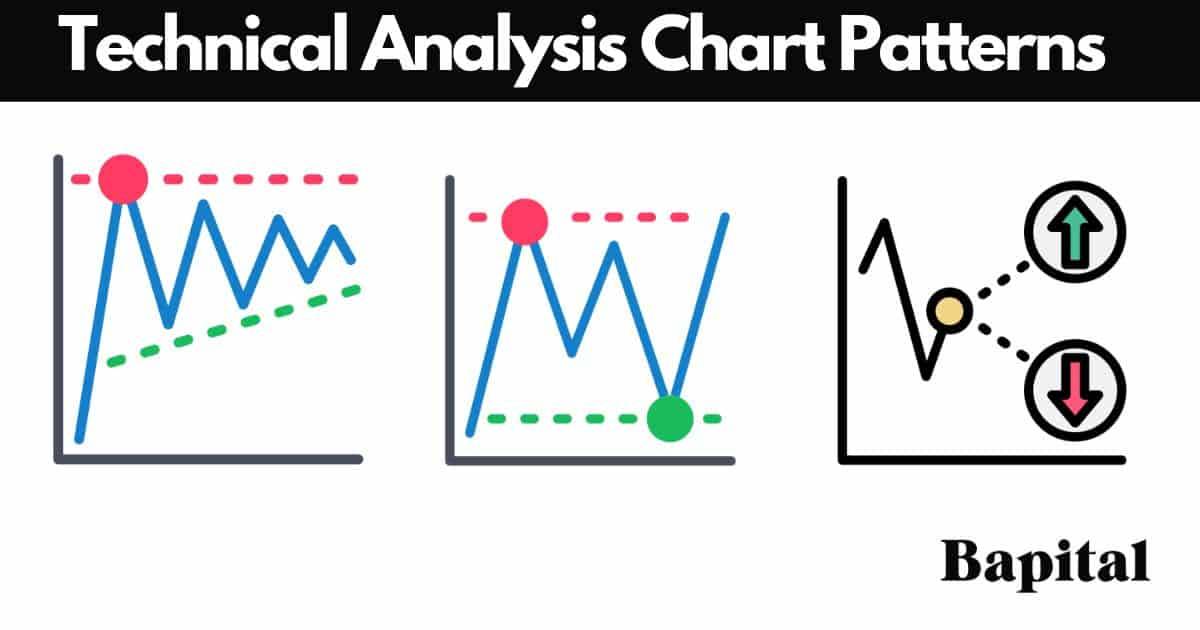
Chart patterns in technical analysis are specific pattern formations or structures that appear on price charts. These patterns are formed by price movements over time and are believed to provide insights into potential future price movements. Traders and analysts use chart patterns to identify trends, reversals, and continuation patterns, which can help inform their trading decisions.
What Are The Types Of Chart Patterns?
There are two types of chart patterns which are continuation patterns and reversal patterns.
Continuation Patterns
Continuation patterns are chart patterns in technical analysis that suggest the continuation of an existing trend rather than a market trend reversal. These patterns occur during consolidation periods within a prevailing trend, indicating that the market is taking a brief pause before resuming its previous trend direction. Continuation patterns are useful for traders looking to identify potential entry points in the direction of the prevailing trend. The continuation patterns examples include flags, pennants, rectangles, gaps, and triangle patterns.
Reversal Patterns
Reversal patterns are chart patterns in technical analysis that indicate a potential direction change of the prevailing trend. These patterns are crucial for traders as they may signal the end of an existing trend and the beginning of a new one, providing opportunities to enter trades in anticipation of a significant price movement in the opposite trend direction. The reversal patterns examples include head and shoulders pattern, inverse head and shoulders, double top and double bottoms, triple tops and triple bottoms, and rounding tops and rounding bottoms.
What Are Examples Of Chart Patterns In Technical Analysis?
The chart pattern examples are illustrated below.
4. Technical Indicators
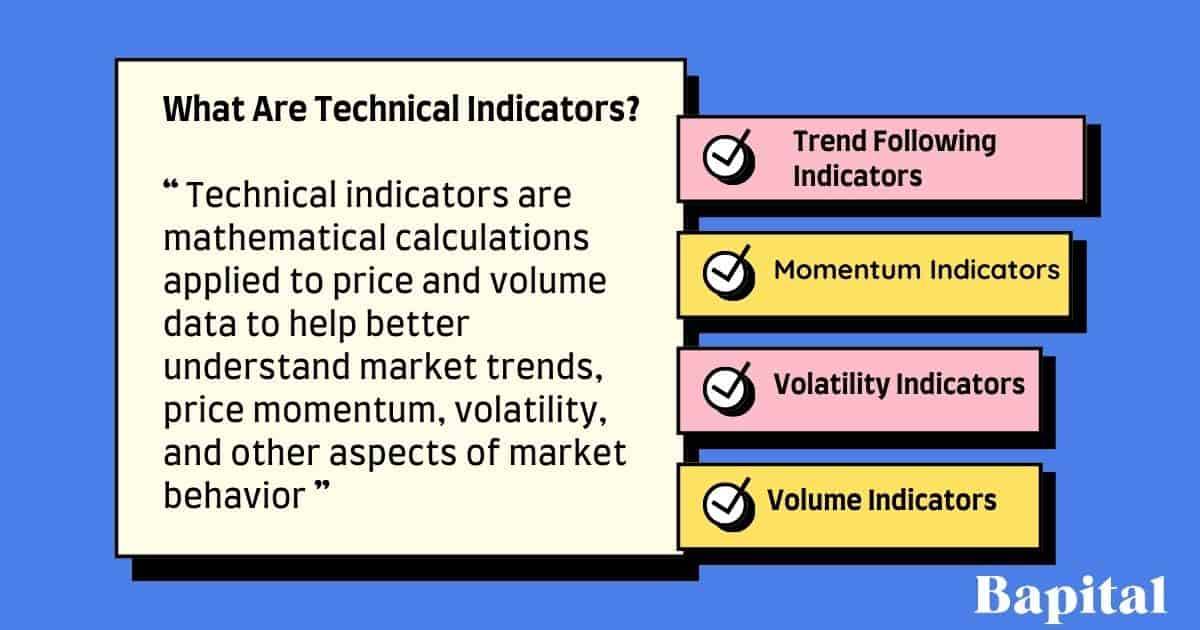
Technical analysis indicators are mathematical calculations applied to price and volume data to help better understand market trends, price momentum, volatility, and other market behavior aspects. These technical indicators can be classified into four categories based on their function and the type of data they analyze. The categories of technical trading indicators are trend-following indicators, momentum indicators, volatility indicators, and volume indicators.
Trend-Following Indicators
A trend-following indicator is a type of technical analysis indicator used to identify the direction of an underlying trend in a financial market. Trend-following indicators are designed to capture price trends over time, allowing traders to potentially profit from sustained trends. These indicators work best in markets that exhibit clear and persistent bullish or bearish trends. Trend indicator examples include moving averages, parabolic sar, moving average convergence divergence (MACD), average directional index (ADX), donchian channels, trendlines, and ichimoku clouds.
Momentum Indicators
Momentum indicators are technical analysis trading indicators used to measure price movement speed and strength in a financial market. These technical trading indicators help identify overbought and oversold conditions, potential trend reversals, and the overall momentum of price movements. Momentum indicator examples include the relative strength index (RSI), stochastics oscillator, commodity channel index (CCI), and the rate of change (ROC).
Volatility Indicators
Volatility indicators are technical analysis indicators used to measure the degree of variation in price movements of a financial instrument over a specified period. These trading indicators help traders identify periods of high volatility or low volatility, which can inform trading strategies, risk management, and position sizing. Volatility indicator examples include bollinger bands, average true range (ATR), chaikin volatility (CHW), volatility index (VIX), and keltner channels.
Volume Indicators
Volume indicators are technical analysis indicators used by traders to analyze the trading volume of a financial instrument over a specified period. Volume is an essential component of market analysis as it provides insight into the strength and conviction behind price movements. Volume indicators help traders identify trends, confirm trend reversals, and assess the overall market sentiment. Volume indicator examples include the volume indicator, on-balance volume (OBV), accumulation/distribution line (A/D line), chaikin money flow (CMF), volume weighted average price (VWAP), and the price volume trend (PVT).
What Are Examples Of Technical Indicators?
The technical analysis indicator examples are displayed below.
5. Trend Analysis
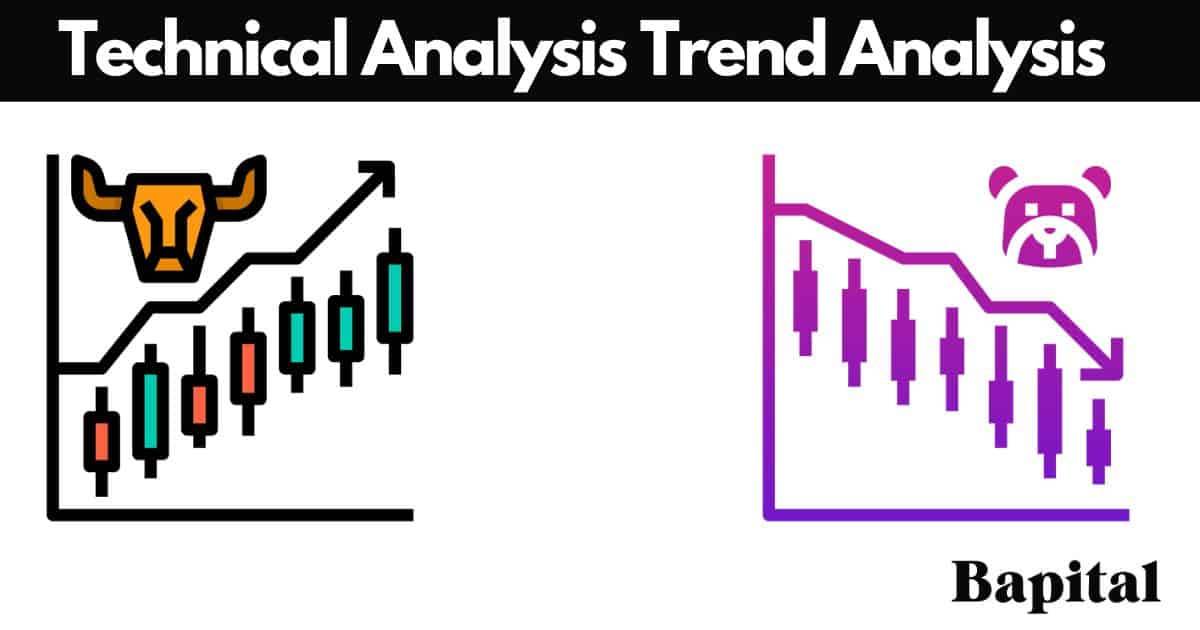
Trend analysis in technical analysis involves the examination of historical price data to identify and analyze market trends. Traders and analysts use trend analysis to understand the direction and strength of trending prices over time, which can help them make informed trading decisions. The main objective of trend analysis is to identify trend direction. A trend is a general direction in which prices are moving over time. Trend indicatos and trendlines help understand trending market environments. There are three types of trends which are an uptrend, downtrend, and sideways trend.
What Is An Uptrend?
An uptrend is when market prices make higher swing highs and higher swing lows over a time period. This indicates that buying pressure outweighs selling pressure, leading to price increases. Uptrends are typically characterized by rising moving averages, bullish chart patterns, and strong buying volume during upward price movements.
What Is A Downtrend?
A downtrend is when asset prices make lower swing lows and lower swing highs over time. This suggests that selling pressure outweighs buying pressure, leading to price decreases. Downtrends are typically characterized by falling moving averages, bearish chart patterns, and strong selling volume during downward price movements.
What Is A Sideways Trend?
A sideways trend is when market prices fluctuate within a narrow price range, moving sideways without establishing a clear upward or downward direction. This is often referred to as price consolidation or a trading range. During sideways trends, prices fluctuate between support and resistance levels with no significant trend in either direction.
What Are Trendlines?
Trendlines are diagonal lines drawn on a price chart to connect significant highs or lows in a trend. In an uptrend, trendlines are drawn below price, while in a downtrend, trendlines are drawn above price. Trendlines help traders visualize the direction and strength of a trend and identify support areas and resistance areas.
6. Support and Resistance Levels
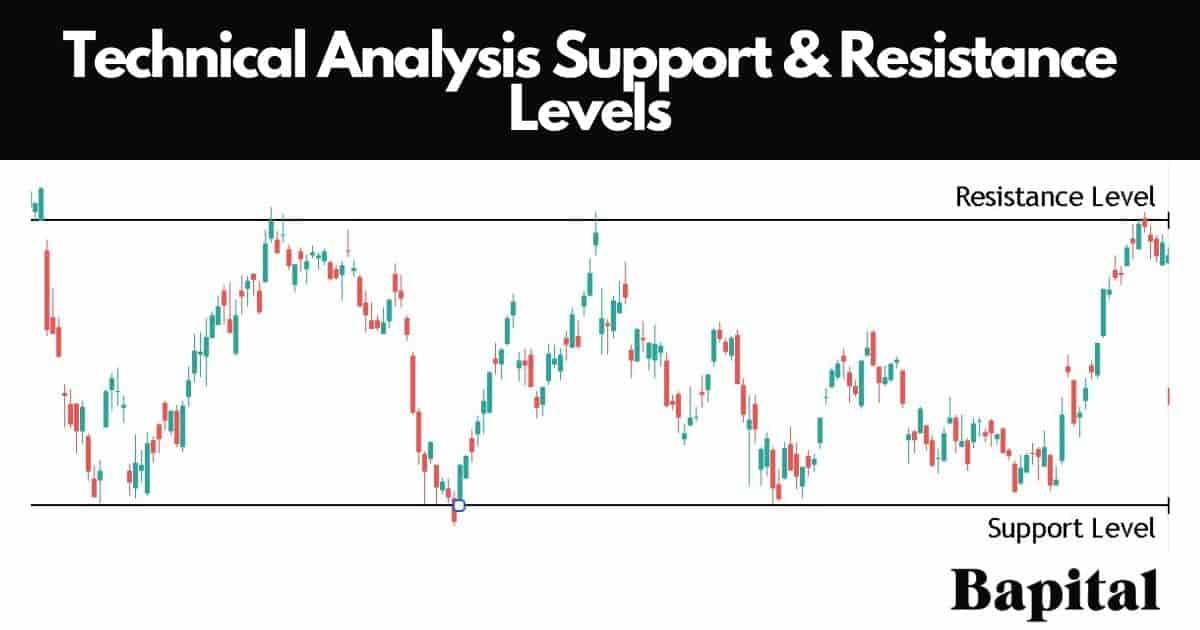
Support and resistance levels are price levels identified using technical analysis where buying or selling pressure tends to be significant. Support levels are where buying interest is expected to be strong enough to prevent the price from falling further and a price bounce is expected, while resistance levels are price levels where selling interest is expected to prevent the price from rising further and a price retracement is expected. These market levels are identified based on historical price movements and are important for identifying potential entry and exit points.
What Are The Types Of Support Levels?
There are three types of support levels which are a horizontal support level, rising support level, and declining support level.
A horizontal support level is a straight horizontal price level where the market price struggles to move lower and the price bounces off it. Typically, the horizontal support level is drawn with a horizontal line from left to right connecting the swing low price levels together.
A rising support level is an uptrend support line where the asset price can not move below. Typically, a rising support level is drawn with an upward sloping line connecting the higher swing lows prices together.
A declining support level is a downtrending price level where the price of a market can not decline below. Typically, the declining support level is drawn with a downtrending line connecting the lower swing low prices together.
What Are The Types Of Resistance Levels?
There are three types of resistance levels which are a horizontal resistance level, rising resistance level, and declining resistance level.
A horizontal resistance level is a straight horizontal level where the market price market can not rise higher. Typically, the resistance level is drawn with a horizontal line connecting the swing high price points together.
A rising resistance level is an upward sloping resistance line where the market price can not move above. Typically, a rising resistance level is drawn by connecting higher swing high price points together.
A declining resistance level is a downtrending level where the market price can not penetrate higher. Typically, the resistance level is drawn with a downward sloping line connecting the lower swing high price points together.
7. Market Sentiment Analysis
Market sentiment analysis in technical analysis involves assessing the overall mood or sentiment of market participants towards a particular financial instrument, market, or economy through the use of technical analysis. Market sentiment seeks to gauge whether investors are optimistic, pessimistic, or neutral about future price movements based on various technical indicators like the put/call ratios and market breadth indicators like the advance-decline line.
What Are Technical Analysis Sentiment Indicators?
Technical analysis sentiment indicators in trading and investing are technical indictors used to gauge the overall sentiment or mood of market participants towards a particular asset, market, or even the broader economy. These indicators provide insights into whether traders and investors are generally optimistic (bullish), pessimistic (bearish), or neutral about the future price direction. Technical analysis sentiment indicators include put/call ratio, volatility index (VIX), bull/bear ratio, smart money vs dumb money index, and new highs vs new lows index.
How To Use Technical Analysis
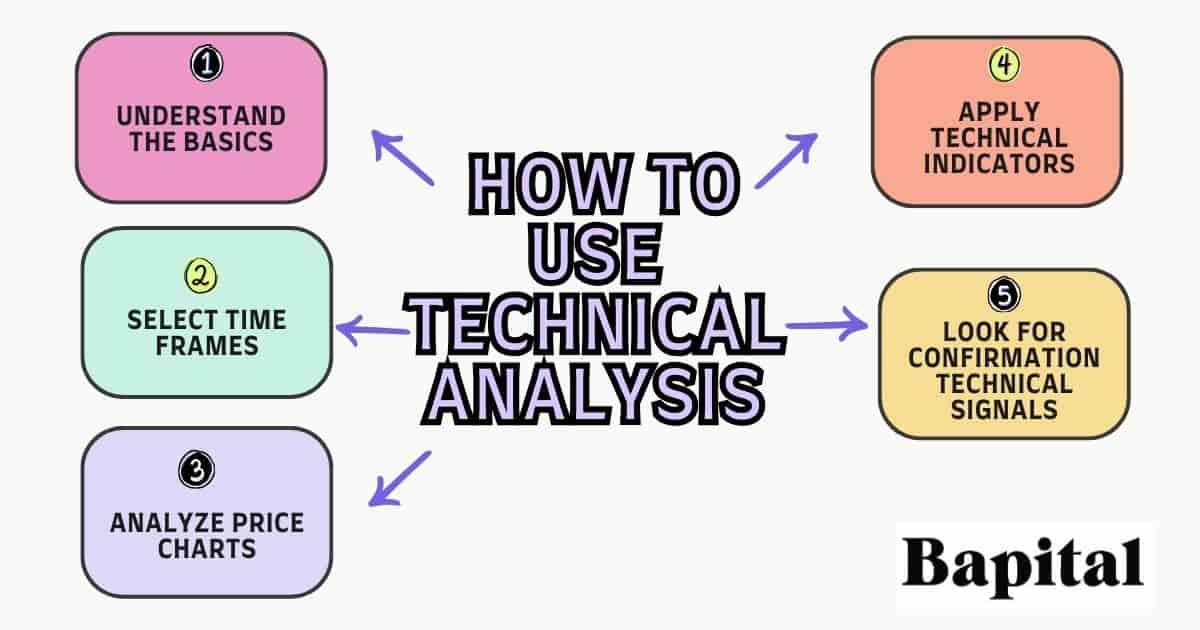
To use technical analysis, follow the steps below.
- Understand the Basics: Before delving into technical analysis, it is essential to grasp the fundamental technical analysis concepts such as support and resistance levels, trends, chart patterns, price charts, and technical indicators
- Select Time Frames: Choose a suitable time frame for technical analysis. Short-term traders might use intraday or hourly charts, while long-term investors might focus on daily or weekly charts
- Analyze Price Charts: Study price charts to identify patterns and trends. Draw trendlines on price charts to identify chart patterns and support and resistance zones
- Apply Technical Indicators: Use various technical indicators to supplement chart analysis including volume, moving averages, bollinger bands, MACD, etc.
- Look For Confirmation Technical Signals: Look for multiple indicator confirmation before making trading decisions. Conflicting technical signals may indicate market uncertainty
How Is Technical Analysis Used For Trade Entries?
Technical analysis is used for trade entries by analyzing historical price data, volume, and various chart patterns to identify potential technical entry points. Traders look for signals such as trendlines, support and resistance levels, moving averages crossovers, pattern breakouts or pattern breakdowns, and momentum indicators like MACD or RSI to determine optimal times to enter trades.
How Is Technical Analysis Used For Setting Trade Risk Management?
Technical analysis is used for setting trade risk management by identifying key resistance and support zones. Traders can use this information to set stop-loss orders below support levels or above resistance levels to limit potential capital losses. Additionally, technical indicators like the average true range help to determine appropriate position sizes based on market conditions, allowing traders to effectively manage risk within their trading strategies.
How Is Technical Analysis Used For Setting Trade Price Targets?
Technical analysis is used for setting trade price targets by identifying major support and resistance price areas or potential technical price reversal areas or technical price bounce areas. Traders may utilize Fibonacci extension levels, previous technical swing highs or swing lows, or technical chart patterns such as triangles or head and shoulders to determine potential price targets. By analyzing these technical factors, traders set realistic profit targets and adjust them as the trade progresses based on emerging market dynamics.
What Is Used To Do Technical Analysis?
Price charts, chart patterns, candlestick patterns, technical analysis theories, and technical indicators are used to do technical analyis of market assets.
What Are The Top Technical Analysis Tools Used By Traders?
The top technical analysis tools used are candlestick price charts, chart patterns like head and shoulders and cup and handles, trendlines, support & resistance levels, technical indicators like moving average overlays, relative strength index (RSI), and fibonacci retracements and candlestick patterns like bullish and bearish hammers, doji, and shooting stars.
What Markets Is Technical Analysis Used In?
Technical analysis is used in all global financial markets including stock markets, forex (foreign exchange) markets, commodity markets, cryptocurrency markets, futures markets, options markets, derivatives markets, and bond markets.
What Market Conditions Is Technical Analysis Used In?
Technical analysis is used in all market conditions including bullish and bearish trending market conditions, narrow rangebound market conditions, low and high volatility market conditions, and high and low volume market conditions.
What Types Of Trading Uses Technical Analysis?
Technical analysis is used in all types of trading including day trading, swing trading, position trading, long-term trading, and scalping.
What Trading Strategies Use Technical Analysis?
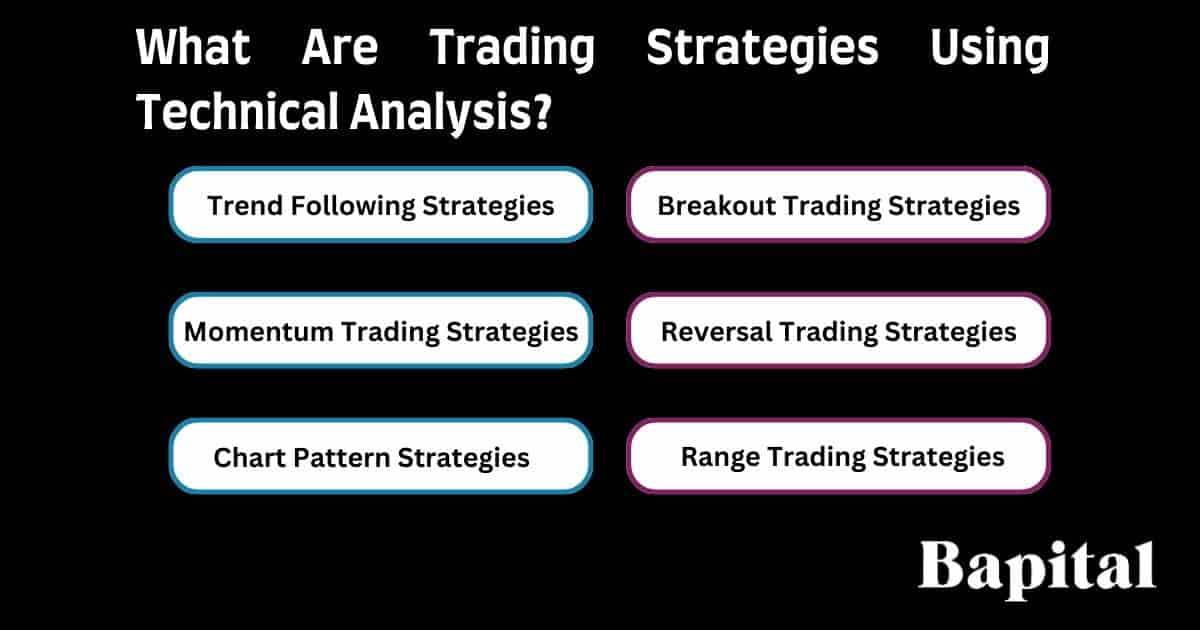
The technical analysis trading strategies are trend following trading strategies, range trading strategies, breakout trading strategies, momentum trading strategies, reversal trading strategies, and chart pattern trading strategies.
Trend following trading strategies are technical analysis strategies involving identifying and trading in an established trend direction. Traders use technical analysis to identify securities that are making higher price highs and higher price lows in uptrends to generate technical buy signals or lower price highs and lower price lows in downtrends to generate technical sell signals.
Range trading strategies are technical analysis strategies used by traders to take advantage of price movements within a defined price range or price channel. These strategies are applied in markets where the price fluctuates within a certain range for an extended period without a clear trend in either direction.
Breakout trading strategies are a technical analysis method that focuses on identifying instances when the price of an asset breaks out of a predefined trading range or consolidation pattern. These breakout strategies aim to capitalize on the momentum generated by such breakouts, with the expectation that the price will continue to move in the breakout direction.
Momentum trading strategies in technical analysis focus on identifying and riding trends in asset prices. These momentum strategies rely on the principle that assets that have been performing well in the recent past are likely to continue performing well in the near future, and vice versa. Momentum traders aim to capture profits by entering positions in the direction of underlying price trends.
Reversal trading strategies use technical analysis to identifying price turning points, where the prevailing trend is likely to reverse direction. These reversal strategies aim to capture profits by entering positions counter to the current trend, with the expectation that a price reversal will occur.
Chart pattern trading strategies involves using technical analysis to identify specific patterns formed by price movements on a price chart and using these patterns to make trading decisions. These market patterns are believed to repeat over time and provide insights into potential future price movements.
What Are The Most Popular Trading Strategies Used In Technical Analysis?
The most popular technical analysis trading strategies are the trend following trading strategies, breakout trading strategies, and chart pattern trading strategies.
How Do Traders Backtest Technical Analysis Trading Strategies?
Technical analysis strategy backtesting involves testing a strategy performance using historical market data to evaluate its effectiveness and profitability over a set period of time in the past.
The technical analysis strategy backtesting steps are listed below.
- Define The Strategy: The first step is to clearly define the strategy rules and parameters. This includes specifying the trading indicators, chart patterns, technical entry and exit conditions, position sizing, risk tolernace, and any other relevant criteria
- Gather Historical Price Data: The second step is to obtain historical market data for the asset or market you want to test your strategy on. This data should include price, volume, and any other relevant information needed to apply your strategy. You can often find historical data from financial data providers, trading platforms, charting software providers, or online financial databases
- Set Up a Backtesting Environment: The third step is to use a backtesting platform to create a simulated trading environment where you can apply your technical trading strategy to historical data. There are many backtesting tools available, ranging from simple spreadsheet-based solutions to more advanced trading software with built-in backtesting capabilities
- Implement The Strategy: The fourth step is to program or input your technical analysis strategy into the backtesting software. This may involve coding the strategy using a programming language like Python or using the built-in features of the backtesting platform to define your strategy rules
- Run the Backtest: The fifth step is to run the backtest using the historical data. The backtesting software will simulate trading according to your strategy rules, generating technical buy signals and technical sell signals and tracking the strategy performance over time
- Evaluate the Results: The sixth step is to analyze the backtesting results to assess the strategy performance. Key metrics to consider include profitability, risk-adjusted returns, win rate, maximum drawdown, average trade duration, average win amount, average loss amount, and other relevant performance indicators. Pay attention to both quantitative metrics and qualitative factors such as the strategy consistency and robustness
- Optimize and Refine: The seventh step is to refine and optimize your technical strategy as needed. This may involve tweaking the parameters, adding filters or additional rules, or incorporating new indicators to improve performance. Repeat the backtesting process iteratively until you are satisfied with the trading results
- Paper Trade or Live Test: The eighth step is to paper trade (simulate trades in real-time without risking real money) or conduct live testing with a small amount of trading capital to further validate its performance before deploying it in live trading
Who Uses Technical Analysis?
Technical analysis is used by financial market students, financial writers, market data analysts, hedge funds, financial journalists, market commentators, technical analysts, traders, chartered market technicians, and investors to analyse capital markets and interpret market data.
What Type Of Traders Use Technical Analysis?
The technical analysis traders are scalpers, day traders, swing traders, position traders, and long-term traders.
Who Are Successful Traders Using Technical Analysis?
Successful technical analysis traders include Mark Minvervini, Kristjan Kullamägi, Nathan Michaud, David Ryan, Jesse Livermore, Nicholas Darvas, and Martin S. Schwartz.
What Software Enables Using Technical Analysis?
Technical analysis software that enables using technical analysis includes TradingView, Interactive Brokers charting solutions, Finviz, StockCharts, MetaStock, Trade Ideas, NinjaTrader, Thinkorswim, TC2000, TrendSpider, ProRealTime, eSignal, Etrade Charting Software, MarketGear, and Slope Of Hope.
What Apps Enable Using Technical Analysis?
Technical analysis apps that enable using technical analysis are the TradingView app, Trendspider app, and ThinkorSwim app.
Why Should Technical Analysis Be Used?
Technical analysis should be used because it provides a systematic framework for analyzing historical price data and patterns to forecast future price movements. By leveraging charts, trends, and a variety of technical indicators, technical analysis practitioners can make informed market decisions about market entry and market exit points. This analytical approach is essential for managing risk effectively, as it allows traders to set stop-loss orders and assess risk-to-reward ratios and enter higher probability trades only.
What Are The Approaches Of Technical Analysis?
The two technical analysis approaches are a top-down technical analysis approach and a bottom-up technical analysis approach.
1. Top-Down Technical Analysis Approach
A top-down technical analysis approach is a method used by traders and analysts to evaluate markets starting from a broad perspective and then narrowing down to more specific details. This approach involves analyzing various levels of data, such as the overall market conditions, sector performance, and individual stock or asset behavior. It starts firstly with macro level analysis which involves analysing overall market conditions followed by sector technical analysis which involves using technical analysis in a specific market sector followed finally by individual asset analysis which involves doing technical analysis on a security within a sector.
2. Bottom-Up Technical Analysis Approach
A bottom-up technical analysis approach is a method used by traders, investors, and market technicians to evaluate capital markets starting from analysing individual market securities first and then working out to broader markets. This bottom-up approach starts with the individual security analysis first, sector analysis second, and then overall broad market analysis third. A bottom-up technical analysis approach is the inverse of a top-down approach.
What Are The Benefits Of Technical Analysis?
The technical analysis benefits are listed below.
- Objective Decision Making: Technical analysis relies on quantitative data such as price and volume, allowing for objective decision making without the influence of emotions or subjective opinions
- Helps Identify Trends: Technical analysis helps identify trends in market asset prices, allowing traders to capitalize on potential profit opportunities by trading in the direction of the trend
- Pattern Recognition: By analyzing chart patterns and market indicators, technical analysis enables traders to identify recurring market patterns that may indicate future price movements, such as trend reversals or continuations
- Great For Timing Entry and Exit Points: Technical analysis provides tools and techniques for timing trade entry and trade exit points, allowing traders to enter positions at favorable prices and exit positions before potential trade reversals
- Improves Risk Management: Technical analysis helps traders manage risk by setting stop-loss orders, identifying support and resistance levels, and assessing potential reward-to-risk ratios for trades
- Universal Applicability Across Markets: Technical analysis can be applied to worldwide financial markets, including stocks, currencies, commodities, futures, options, and cryptocurrencies, making it versatile for traders across different asset classes
- Automation and Algorithmic Trading: Technical analysis can be automated through trading algorithms and computer programs, allowing for systematic trading strategies based on predetermined rules and conditions
What Are The Limitations Of Technical Analysis?
The technical analysis limitations are listed below.
- Subjectivity: Technical analysis relies heavily on interpretation and judgment, making it subjective. Different analysts may draw different trading conclusions from the same data
- Relies On Historical Data: Technical analysis primarily uses past price and volume data to predict future price movements. However, past performance may not always accurately predict future results
- Whipsaws and False Signals: Technical indicators may generate false signals, leading to incorrect trading decisions. This can result in money losses for traders who rely solely on technical analysis
- Overfitting: Overfitting occurs when analysts fit a trading strategy too closely to past data, making it perform well historically but poorly in real-world conditions. This can lead to ineffective trading strategies
- Market Manipulation: Technical analysis assumes that market prices reflect all available information. However, markets can be manipulated by large players, leading to distortions in price patterns and trends
- Time Consuming: Analyzing charts and applying technical indicators can be time-consuming, especially for short-term traders who need to monitor markets frequently
What Are The Pitfalls With Technical Analysis?
The technical analysis pitfalls are an over-reliance on technical indicators, neglecting fundamental analysis, confirmation bias, emotional trading, and ignoring the overall technical market context.
The over-reliance on technical indicator pitfall means traders sometimes fall into the trap of heavy technical indicator reliance without considering other fundamental analysis factors or market sentiment factors. This can lead to missed trade opportunities or incorrect trading decisions.
The neglecting fundamental analysis pitfall means traders and market participants sometimes overlook fundamental factors such as economic data, company earnings, or geopolitical events that can significantly impact market movements. Ignoring these factors can result in trading strategies that are disconnected from underlying market fundamentals.
The confirmation bias pitfall means traders may exhibit confirmation bias, interpreting technical signals in a way that confirms their pre-existing market direction beliefs or biases. This can lead to ignoring contradictory technical analysis evidence or failing to adjust technical trading strategies when market conditions change.
The emotional trading pitfall means technical analysis can sometimes exacerbate emotional trading behaviors such as fear and greed. Traders may become overly confident in their analysis or panic when faced with unexpected market movements, leading to impulsive trading decisions that deviate from their original technical strategy.
The ignoring the overall market context pitfall means technical analysis should be applied within the broader context of market conditions, including volatility, liquidity, and prevailing technical trends. Traders who fail to consider these factors may misinterpret technical signals or enter trades at inopportune times.
How To Learn Technical Analysis
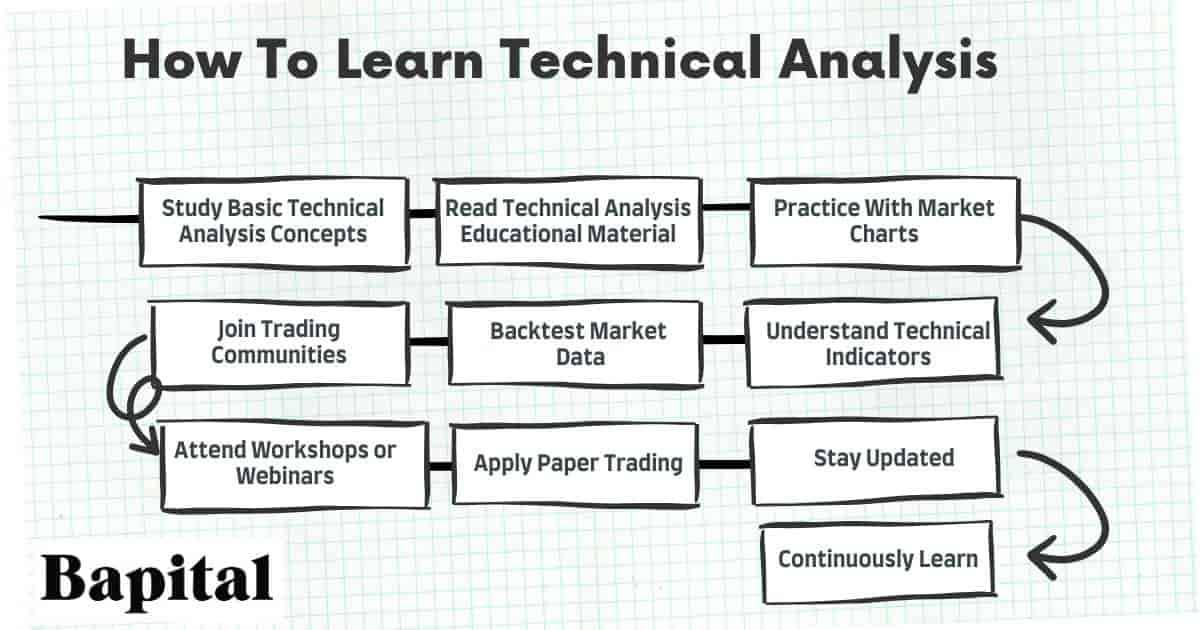
The ten technical analysis learning steps are below.
- Study Basic Technical Analysis Concepts: Beginners should start by understanding the foundational concepts of technical analysis, such as chart patterns, trendlines, volume analysis, support and resistance levels, and technical indicators
- Read Technical Analysis Educational Material: Explore books, online courses, and articles dedicated to technical analysis. Look for technical analysis resources that cover both technical analysis theory and technical analysis practical application
- Practice With Market Charts: Open a technical analysis charting platform or use online resources to practice analyzing charts. Start with simple chart patterns and gradually progress to more advanced technical analysis techniques
- Understand Technical Indicators: Learn about different types of technical indicators, such as moving averages, oscillators, and volume indicators. Understand how each market trading indicator works and how to interpret their signals
- Backtest Market Data: Apply technical analysis techniques to historical market data to test their effectiveness. This will help you gain confidence in your analysis and help to understand how different technical strategies perform in various market price action conditions
- Join Trading Communities: Engage with other traders and technical analysts in online forums, social media groups, or trading communities. Participate in technical analysis discussions, share technical analysis ideas, and learn from others' experiences
- Attend Workshops or Webinars: Look for techncial analysis workshops, webinars, or seminars conducted by experienced technical analysts. These technical analysis events can provide valuable technical analysis insights, practical tips, and real-world technical analysis examples
- Apply Paper Trading: Practice trading without risking real money by using a simulated trading account. This allows you to test your technical analysis skills in a risk-free environment and refine your strategies
- Stay Updated: Stay informed about market developments, new technical analysis tools, and changes in market dynamics. Follow reputable financial news sources, blogs, and techncial analysis industry experts to stay updated
- Continuously Learn: Technical analysis is a skill that requires continuous learning and improvement. Stay curious, explore new technical techniques, and be open to adapting your approach based on market conditions and feedback from your analysis
How Do People Practice Using Technical Analysis?
Technical analysis practice involves using free technical analysis software providers to practice applying various technical indicators, chart patterns, and market overlays to market price charts. Apply technical indicators and chart patterns in different markets and write down the outcome after the chart pattern siganl or technical indicator signal completes. This enables people to practice in a risk free environment.
How Long Does It Take For Beginners To Learn Technical Analysis?
The time it takes to learn technical analysis ranges from 6 to 8 months for most beginners. However, the time length to learn technical analysis can vary significantly depending on various factors, including the individual's level of dedication, prior financial markets knowledge, and technical analysis learning style. Some beginners may grasp the basic concepts of technical analysis relatively quickly while others may require more time and practice to become proficient.
What Are The Best Books To Learn Technical Analysis?
The best technical analysis books to learn from are Technical Analysis Of The Financial Markets by John Murphy, Encyclopedia Of Chart Patterns by Thomas Bulkowski, Technical Analysis Using Multiple Timeframes by Brian Shannon, and Getting Started In Technical Analysis by Jack Schwager.
What Are The Best Technical Analysis Podcasts To Learn From?
The best technical analysis podcasts to learn from are The Allstarcharts Podcast on Technical Analysis Radio, Fill The Gap: The Podcast of the CMT Association, The Weekly Trend, TechnoFunda Investing, Cryptocurrency Technical Analysis, and Dorsey Wright and Associates Technical Analysis Podcast.
What Are The Best Technical Analysis Forums To Learn From?
The best technical analysis forums to learn from are Stocktwits, Elite Trader, Quora, TradingQnA by Zerodha, Reddit r/technicalanalysis, BearBullTraders, TraderJI, and FXGears.
What Are The Best Technical Analysis Instagram Accounts To Learn From?
The best technical analysis Instagram accounts to learn from are Nial Fuller (nialfuller), The Trading Channel (thetradingchannel), Elliottwavecount (elliottwavecount), Stocky Trader (stocky_trader), Trader Vishal Sharma (trader_vishal_sharma), Charles Payne (charlasvpayne), and Thomas (vagafx).
What Are The Best Technical Analysis Twitter Accounts To Learn From?
The best technical analysis twitter accounts to learn from are Brian Shannon (alphatrends), Chris Kimble (KimbleCharting), Helene Meisler (hmeisler), Linda Raschke (LindaRaschke), David Keller (DKellerCMT), Katie Stockton (StocktonKatie), The Chart Report (TheChartReport), and Ian McMillan (the_chart_life).
What Are The Best Websites To Learn Technical Analysis?
The best websites for learning technical analysis are Bapital.com, stockcharts.com, cmtassociation.org, babypips.com, investopedia.com, and artoftrading.net.
What Are The Best Technical Analysis Webinars To Learn From?
The best technical analysis webinars to learn from are FSB Analytics & Education webinar titled "Technical analysis for beginners", Trading With Rayner webinar titled "Ultimate Technical Analysis Trading Course", Fidelity webinar titled "Practical uses for technical analysis", Phillip Capital webinar titled "Using Charting Analysis to Time Market Entry", CMT Association webinar series titled "Technical Analysis Toolkit", Picture Trading Inc. webinar series titled "Foundations of Technical Analysis", and Trading Central webinar titled "The Basics Of Technical Analysis".
What Are The Best Technical Analysis Newsletters To Learn From?
The best technical analysis newsletters to learn from are the Zanger Report, Chartwatchers Newsletter, Chart Advisor, DailyFx Newsletter, and the Daily Rip.
What Are The Best YouTube Channels To Learn Technical Analysis?
The best technical analysis youtube channels to learn from are the trading channel, rayner theo, the chart guys, claytrader, wysetrade, stephen bigalow, shadow trader, and td ameritrade. These top technical analysis youtube channels provide lessons on technical indicators, chart patterns, and general technical analysis application in different market conditions.
What Is Important Terminology in Technical Analysis To Learn?
The most important technical analysis terminology to learn is listed below.
- Chart Patterns: Patterns formed by the price movements of a security depicted on market charts, such as head and shoulders, double top, double bottom, triangle patterns, etc.
- Technical Indicators: Technical indicators are tools used to analyze securities and make investment decisions based on statistical trends derived from trading activity, including moving averages, RSI, MACD, Bollinger Bands, etc.
- Candlestick Patterns: Candlestick patterns are patterns formed by the price movements of a security depicted on candlestick charts. The candlestick patterns examples include the hammer, harami, engulfing bar pattern, morning star, evening star, and three black crows
- Price Charts: Price charts are graphical representations of historical price movements of a financial asset over a specific period of time
- Support and Resistance: Support and resistance are levels where a financial instrument price tends to find support (stops falling) or resistance (stops rising)
- Trend Lines: Lines drawn on a price chart indicating the direction of a trend and potential support and resistance levels
- Moving Averages (MA): A trend-following indicator that smooths out price data by creating a constantly updated average price. Simple Moving Average (SMA) and Exponential Moving Average (EMA) are commonly used to smooth out price data and identify trends
- Relative Strength Index (RSI): A momentum oscillator that measures the speed and change of price movements
- MACD (Moving Average Convergence Divergence): A trend-following momentum indicator that shows the relationship between two moving averages of a security's price
- Volume: The number of shares or contracts traded in a security or market during a given period
- Breakouts and Breakdowns: When a security's price moves above (technical analysis breakouts) or below (technical analysis breakdown) a significant level of support or resistance
- Pullbacks: A price pullback is when the asset price retraces temporarily after a breakout or during a trend, providing opportunities for a trading entry
- Fibonacci Retracement: A technical analysis tool used to identify potential support and resistance levels based on the Fibonacci sequence
- Bollinger Bands: Volatility bands placed above and below a moving average
- Divergence: When the price of a security moves in the opposite direction of an indicator, suggesting a potential reversal in trend
- Backtesting: Technical analysis backtesting involves applying a technical trading strategy to historical market data to evaluate its performance. It helps traders assess the effectiveness of their strategies and make informed decisions about their trading approach
- Liquidity: Liquidity refers to the ease with which a security or asset can be bought or sold in the market without significantly affecting its price. High liquidity means there is a large volume of trading activity and a narrow spread between bid and ask prices, making it easier for traders to enter and exit positions with minimal trade order slippage. Low liquidity indicates limited trading activity and wider bid-ask spreads, which can lead to greater price volatility and trade execution difficulties. Liquidity is measured by reading the financial market order book or by observing the volume indicator
- Technical Buy Point: A technical buy point in technical analysis refers to a specific price level, pattern, or indicator signal that suggests it may be an opportune time to enter a long (buy) position in a security or asset. This buy point is typically identified based on various technical factors such as chart patterns, support levels, or signals from technical indicators
- Technical Sell Point: A technical sell point in technical analysis refers to a specific price level, pattern, or indicator signal that suggests it may be an opportune time to exit a long (sell) position or enter a short trade position in a security or asset. This sell point is identified based on technical factors such as chart patterns (e.g., breakdown from a consolidation pattern), resistance levels, moving average crossovers indicating a potential downtrend, or technical indicator sell signals
What Are Examples Of Applying Technical Analysis?
The technical analysis application in real-world market examples are illustrated below.
Technical Analysis In Stock Market Example
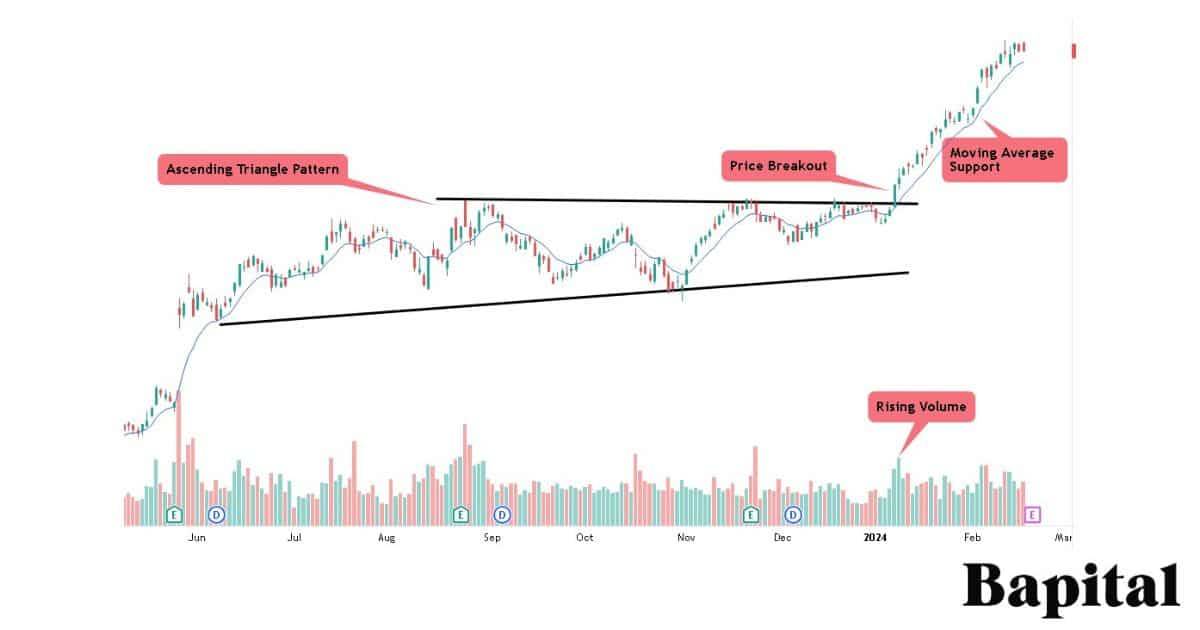
A technical analysis stock market example is displayed on the daily timeframe candlestick stock chart of Nvidia (NVDA) above. There are two technical analysis indicators on the Nvidia stock chart which are the moving average overlay (blue line) and the volume indicator located underneath the price chart. A technical analysis ascending triangle chart patten forms which provides a technical buy point when there is a price breakout above the resistance area on rising buyer volume. The moving average is used to trail a stop-loss order as price increases higher in a bullish trend. This is an example of using technical analysis to identify potential stock price increases.
Technical Analysis In Forex Market Example
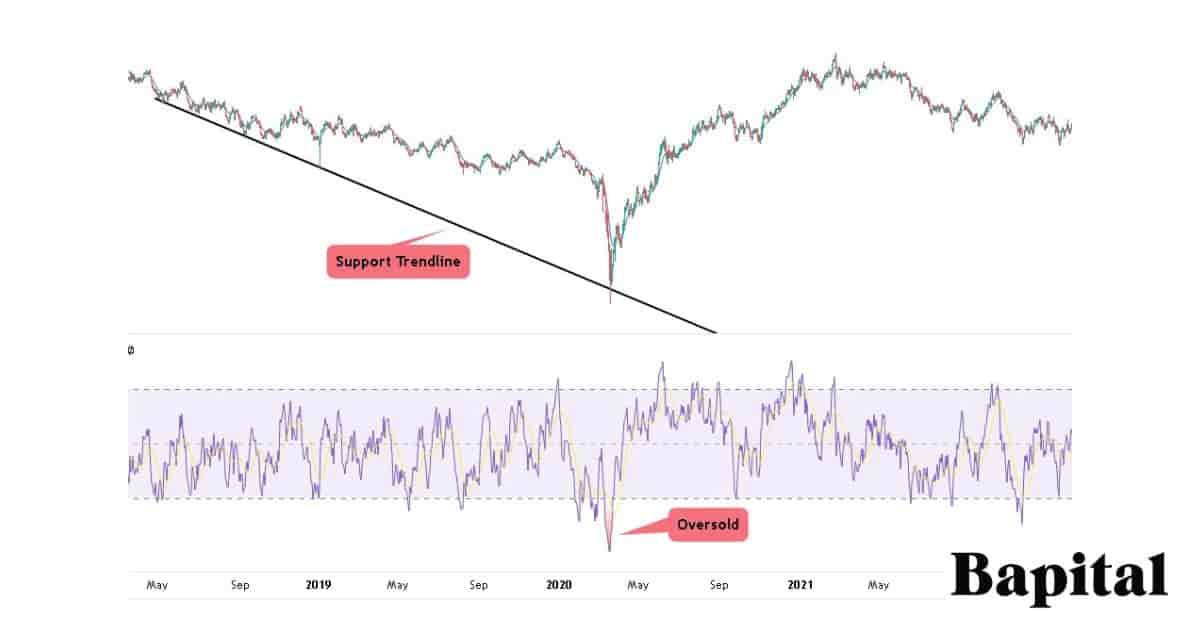
A technical analysis forex market example is shown on the weekly timeframe candlestick forex chart of AUD/USD above. The technical analysis relative strength index (RSI) indicator and a trendline is illustrated on the price chart. As the currency price drops into the support trendline with the rsi level at extreme oversold levels, it signals a technical buy level for traders using technical analysis. This is an example of using technical analysis to identify potential forex price reversals from bearish to bullish price action.
What Are Careers In Technical Analysis?
Technical analysis careers include technical analysts, chartered market technicians, financial writers, market journalists, market data analysts, hedge fund data analysts, portfolio managers, market research analysts, financial advisors, risk managers, quantitative analysts (Quants), investment strategists, traders, and investors.

What Is a Technical Analyst?
A technical analyst, also known as a chartist, is an individual who specializes in the practice of technical analysis, which involves analyzing historical market data, primarily price and volume, to forecast future price movements and identify trading opportunities. A technical analyst uses various technical tools and technical techniques, such as chart patterns, technical indicators, trendlines, volume analysis, and statistical analysis, to interpret market behavior and make informed trading decisions.
What Is A Chartered Market Technician?
A Chartered Market Technician (CMT) is a professional designation for individuals who specialize in technical analysis of financial markets. The CMT designation is awarded by the Market Technicians Association (MTA) to individuals who demonstrate proficiency in technical analysis theory, application, and ethical standards.
What Are Myths Of Technical Analysis?
The technical analysis myths are technical analysis does not work, only retail traders make money, technical analysis is a get rich quick strategy, all technical indicators work equally well, and technical analysis is a self-fulfilling prophecy.
The technical analysis myths are listed below.
- Technical Analysis Does Not Work: The technical analysis myth that technical analysis does not work has been proven to be false. A study published in the Journal Of Finance And Quantitative Analysis, Volume 51, Issue 6 titled "Sentiment and the Effectiveness of Technical Analysis: Evidence from the Hedge Fund Industry" showed the results of a unique test on the effectiveness of technical analysis in different sentiment environments. The findings from the study were that hedge funds using technical analysis during high-sentiment periods exhibited higher performance, lower risk, and superior market timing ability than non-users of technical analysis
- Only Retail Traders Use Technical Analysis: The technical analysis myth that only retail traders use technical analysis is false. Hedge funds, high frequency trading firms, prop firms, and large investing firms utilize technical analysis to make trading and investing decisions. The book "Hedge Fund Market Wizards" by Jack D. Schwager provide evidence of hedge funds using technical analysis in real market environments
- Technical Analysis Is A Get Rich Quick Strategy: The technical analysis myth that technical analysis is a get rich quick strategy is false. Some new traders and beginner technical analysts believe that mastering technical analysis will lead to quick and easy market profits. However, successful trading requires discipline, risk management, and a deep understanding of market dynamics, which cannot be achieved overnight
- All Technical Indicators Work Equally Well: All technical indicators work equally well is false. There is a wide range of technical indicators available, but not all of them are equally effective in all market conditions with trend following indicators working best in trending markets while volatility indicators work better in higher volatility market environments. Traders need to understand the technical indicator strengths and limitations and use them judiciously based on market context
- Technical Analysis Is Always Accurate: Technical analysis is always accurate is false. One of the most prevalent myths is that technical analysis always predicts price movements accurately. In reality, technical analysis provides probabilities and potential scenarios based on historical data and patterns, but it does not guarantee future outcomes
- Technical Analysis Is A Self-Fulfilling Prophecy: Technical analysis being a self fulfilling prophecy is a myth. While technical analysis can influence market sentiment and short-term price movements, it is just one of many factors that traders consider when making decisions in the financial markets. Market dynamics are shaped by a variety of factors, including fundamental news, economic indicators, geopolitical events, and investor sentiment, which can outweigh the impact of technical analysis alone
What Are The Industries And Associations Of Technical Analysis?
The main technical analysis industries and associations are the International Federation Of Technical Analysts (IFTA), Chartered Market Technician Association (CMT Association), American Association Of Technical Analysis (AAPTA), Technical Security Analysts Of San Francisco (TSAASF), Society Of Technical Analysts (STA), Institute Of Technical and Quantitative Analysts (IEATEC), and the The Association of Technical Analysts (ATA).
1. International Federation Of Technical Analysts (IFTA)
The IFTA is a global organization of market analysis associations. The IFTA offers two certifications to its members, the Certified Financial Technician and the Master Of Financial Technical Analysis. It was introduced in 1986 and has member societies in 21 countries.
2. Chartered Market Technician Association (CMT Association)
The CMT Association is an American association of technical analysts. The CMT Association is credentialing and advocacy body that offers three exams for its members: CMT Level 1, CMT Level 2 and CMT Level 3.
3. American Association Of Technical Analysis (AAPTA)
The AAPTA is another American association of technical analysts. It was incorporated in 2004. This association offers networking events and conferences for technical analysts to meet other like-minded individuals.
4. Technical Security Analysts Of San Francisco (TSAASF)
The TSAASF is another American association of technical analysts. It was formed in 1970 and is the oldest society in the United States devoted to the study and development of technical analysis. The TSAASF offers members access to seminars, lunches, meetings and a newsletter to help them stay up to date on technical analysis skills.
5. Society Of Technical Analysts (STA)
The STA is a United Kingdom association of technical analysts. Members get access to meetings by leading practitioners, networking events, videos, a forum, a journal published twice a year and courses to learn technical analysis.
6. Institute Of Technical and Quantitative Analysts (IEATEC)
The IEATEC is a Spanish association of technical analysts. Members receive training, tools, meetings, webinars and exams and certifications on technical analysis in Spanish.
7. The Association of Technical Analysts (ATA)
The Association Of Technical Analysts (ATA) is a technical analysis association based in India. Members of the association have access to meetings, webinars and training on technical analysis. The ATA was incorporated in 1986.
What Are Alternatives To Technical Analysis?
The techncial analysis alternatives are fundamental analysis and quantitative analysis.
What Is The Difference Between Technical Analysis vs Fundamental Analysis?
Technical analysis is different to fundamental analysis because technical analysis relies on historical price data, price patterns, and technical indicators to predict future price movements while fundamental analysis assesses the underlying market security value based on its fundamentals, intrinsic value, and long-term growth prospects to make market price predictions.
Technical analysis operates on the assumption that historical price data contains all relevant market information about a security and that price movements follow predictable patterns while fundamental analysis assumes that markets are not always efficient and that mispricings can occur due to irrational investor behavior or temporary market inefficiencies. It seeks to uncover undervalued or overvalued assets based on their fundamental characteristics.
What Are The Key Facts Of Technical Analysis?
The technical analysis key facts are below.
