What Is a Head and Shoulders Pattern In Technical Analysis?
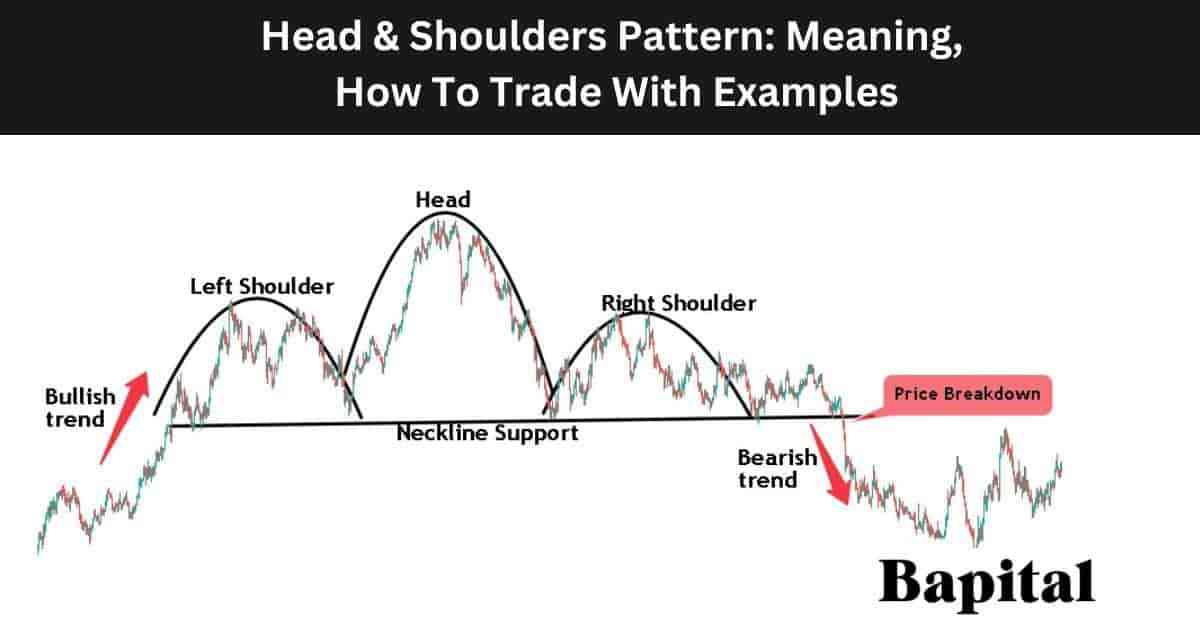
A head and shoulders pattern is a bearish reversal pattern in technical analysis that signals a price reversal from a bullish to bearish trend. It typically forms at the end of a bullish trend. The pattern is shaped with three peaks, a left shoulder peak, a higher head peak, and a right shoulder peak similar in height to the left shoulder. The pattern gets its name as it resembles the outline of a head with two shoulders. The head and shoulders is strictly a reversal pattern and it is not a continuation pattern.
What Does a Head and Shoulder Pattern In Technical Analysis Mean?
A head and shoulder pattern means the market is primed for a bullish to bearish reversal and falling market prices are expected if the asset price drops below the neckline support line.
What Is An Alternative Name For A Head and Shoulders Pattern In Technical Analysis?
A head and shoulder pattern's alternative name is "head and shoulders top". The head and shoulder pattern's abbreviation is H&S.
What Is The Importance Of a Head and Shoulders Pattern?
A head and shoulders pattern is important as it signifies potential declining market prices if the market price breaks down below the pattern's support line and it is important as it indicates to bullish traders to take profits and expect potential bearish price action.
What Technical Indicators Are Used With Head and Shoulder Patterns?
A head and shoulders pattern is used with technical analysis indicators like the exponential moving average overlay, volume indicator, VWAP, RSI trading indicator, average true range, and Keltner channels in technical analysis.
What Are The Components Of a Head and Shoulders Pattern?
The 4 head and shoulder pattern components are below.
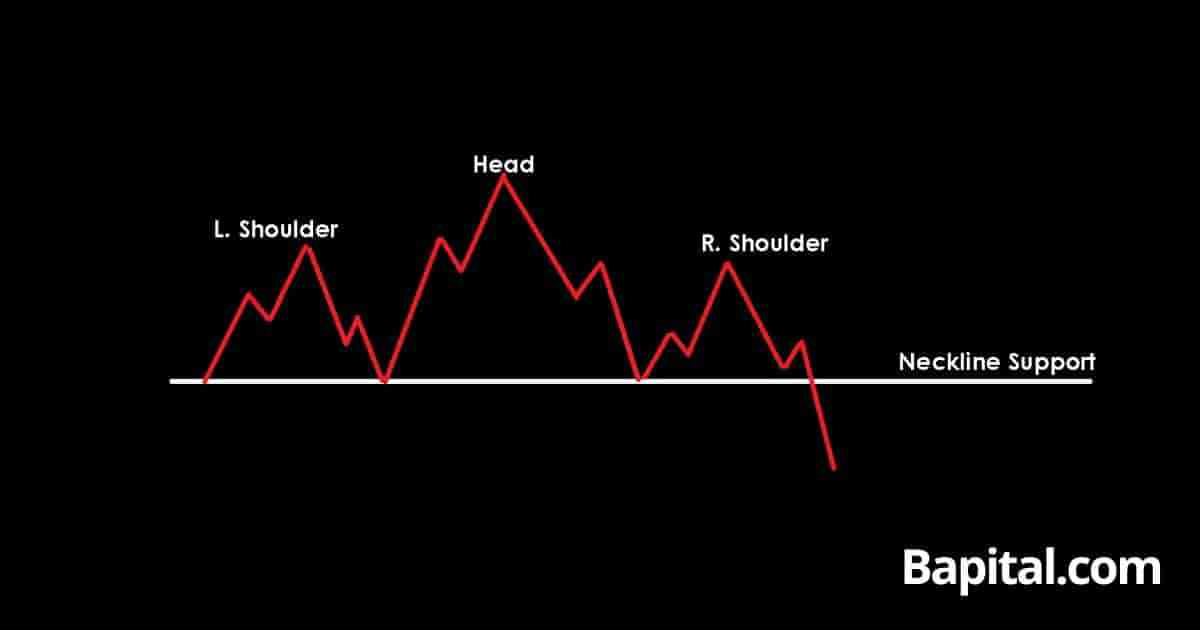
- Left Shoulder: This is the left-hand side of the head and shoulders pattern that forms first and is shaped like a shoulder. It is shaped like the letter "n" and consists of two swing low price points and one swing high price point
- Head: This is the center of the head and shoulders pattern that forms second and is shaped like a head or a larger letter "n". It is a higher swing high than the left and right shoulders on a price chart. The head consists of one swing high price peak and one swing low price trough
- Right Shoulder: This is the right-hand side of the head and shoulders pattern that forms third and is shaped like a shoulder or a small letter "n" similar to the left shoulder component. It has a lower swing high than the head component with the swing high matching the swing high price of the left shoudler. The right shoulder consists of one swing high price level and one swing low price level
- Neckline: The head and shoulder pattern neckline component is the support level of the pattern that forms fourth. The neckline can be slanted upward or downward or be horizontal depending on market conditions. The neckline connects the swing low prices of the left shoulder, head, and right shoulder component together. The neckline support line connects the four swing low points of the pattern together
What Is The Formation Process Of a Head and Shoulder Pattern?
The head and shoulder pattern formation process begins with the left shoulder component forming on the left side of the pattern. The left shoulder forms when there is a bullish price trend in an upward direction before a price pause and retracement as market prices struggle to rise higher. This price pullback leaves a swing high peak marking the left shoulder's swing high point and the beginning of the pattern formation.
Secondly, the head component forms after the left shoulder component and is the middle part of the pattern. The head forms when the market price breaks above the left shoulder's swing high point and continue in a bull trend but the price fails and drops back down.
Thirdly, the right shoulder forms after the head component and is the right hand side of the pattern. The right shoulder forms when the asset price coils and attempts to push higher again but fails at a swing high price similar to the swing high price of the left shoulder. The price finds resistance and drops lower back to the support area low.
Fourthly, the support neckline forms after the right shoulder and is located at the low point of the pattern. The neckline forms when there are three of more swing low points where prices failed to drop below and these swing low points are connected by a horizontal or sloped trend line.
Finally, the pattern's price breakdown is the final part of the formation process and renders the pattern complete. The price breakdown forms when the asset price begins to see increased selling pressure and the market is showing bearish signs. The price penetrates the neckline support level and trends lower in a bearish direction marking lower swing lows and lower swing highs as the price falls.
What Happens After a Head and Shoulders Pattern Forms?
After a head and shoulders pattern forms, a bullish to bearish trend reversal occurs as the market price drops below the neckline support area and continues falling lower with increased bearish momentum and traders enter shorting trade positions as the price penetrates the support neckline point anticipating lower market prices.
What Causes a Head and Shoulders Pattern To Form?
The head and shoulders pattern is caused by a period of buyer exhaustion after a bullish trend where buyers and sellers compete to establish dominance. The initial left shoulder sees buying pressure prevail before traders take profits and the price pulls back forming the left shoulder. Buyers aggressively buy the price pullback and the market price breaks out to a new swing high but buyers are not able to establish a new trend and the sellers start to sell the new highs causing the head to form.
As the price pulls back again, buyers once again attempt to buy the dip hoping for a continued move higher in a bullish trend but the security price fails to reach the resistance level of the head and instead reverses causing the right shoulder to form.
How Long Does a Head and Shoulders Pattern Take To Form?
Head and shoulder pattern formation timeframe ranges from a minimum of 45 minutes on a 1-minute price chart to 45+ years on a yearly price chart. To calculate the head and shoulders pattern formation duration, multiple the chart timeframe used by 45. For example, a head and shoulders pattern on a 30-minute price chart takes a minimum of 1,350 minutes (30 minutes x 45) to form.
How Often Do Head and Shoulders Form?
A head and shoulders pattern occurs 1 - 2 times per year on a daily timeframe chart in a financial market depending on the market environment. Shorter timeframe market charts see the head and shoulders chart pattern form more frequently.
What Type Of Price Charts Do Head and Shoulders Form On?
Head and shoulder patterns form on candlestick charts, line charts, point and figure charts, area charts, open high low close (OHLC) charts, and bar charts.
What Markets Do Head and Shoulder Patterns Form In?
A head and shoulder pattern forms in all global markets including stock markets, bond markets, cryptocurrency markets, indices, futures markets, commodity markets, options markets, and foreign exchange (forex) markets.
What Timeframe Price Charts Do Head and Shoulder Patterns Form On?
The head and shoulders pattern forms on all timeframes from short timeframe 1-second price charts to higher timeframe yearly price charts and all custom timeframes.
How Do Traders Identify Head and Shoulder Patterns?
A head and shoulders pattern is identified by its shape and position within a price trend on a financial market chart. The head and shoulders identity involves traders looking for price patterns similar to the shape of a head with two shoulders with the two shoulders looking similar to a small letter n and the head looking like a larger letter n. Traders also use the market environment to assist with head and shoulders pattern identification with bullish price trends being the type of price action to identify these chart patterns.
How Do Traders Find Head and Shoulder Patterns?
Head and shoulder formations are found by scanning the financial markets with a head & shoulder charting scanner, checking the online profiles of top traders or expert chartered market technicians (CMT), browsing the price charts manually, or by checking trading broker software.
How Do Traders Scan For Head and Shoulder Patterns?
Traders scan for head and shoulders pattern by using the finviz.com head and shoulders scanner, scanning using a trading broker's head and shoulder screener, and by scanning through TradingView's chart pattern scanner.
How Do Traders Draw a Head and Shoulders Pattern?
A head and shoulder pattern drawing involves firstly plotting the left shoulder component of the pattern which involves drawing a smooth rounded "n" shape on the price chart from left to right. Draw a curved line starting with the left swing low price level to the left shoulder swing high price and then back down to the second swing low price level of the left shoulder.
Secondly, plot the head component which involves drawing a larger "n" shape from left to right. Start from the head components left swing low point and draw a curved line to the head swing high price and then back down to the head component's right swing low point.
Thirdly, plot the right shoulder component which involves drawing a smaller "n" shape in the same way as the left shoulder by starting with the right shoulders first swing low price point and drawing a curved line to the right shoulder swing high price and then back down the corresponding right-hand side swing low price.
Finally, plot the pattern's neckline support level by drawing a trendline from left to right connecting all the pattern's swing low prices together.
How To Trade a Head and Shoulders Pattern
The 7 head and shoulder pattern trading steps are listed below.
- Identify the head and shoulders on a market price chart
- Enter a short trade when the price breaks the pattern support area
- Set a price target order for trade position profit taking
- Place a stop-loss order above the right shoulder's swing high price
- Analyze the trading volume as the market price drops lower
- Adapt to the market conditions dynamically
- Conduct post-trade analysis
1. Identify The Head and Shoulders Pattern On A Market Price Chart
The first head and shoulders pattern trading step is to identify the chart pattern on a price chart. Browse market charts manually or apply a chart pattern screener to find and identify the head and shoulder formations in market securities.
2. Enter A Short Trade When Price Breaks Pattern Support
The second head and shoulder pattern trading step is to enter a short trade position when the asset price penetrates the pattern support line on increased selling volume.
What Is The Entry Point Of Head and Shoulders Pattern?
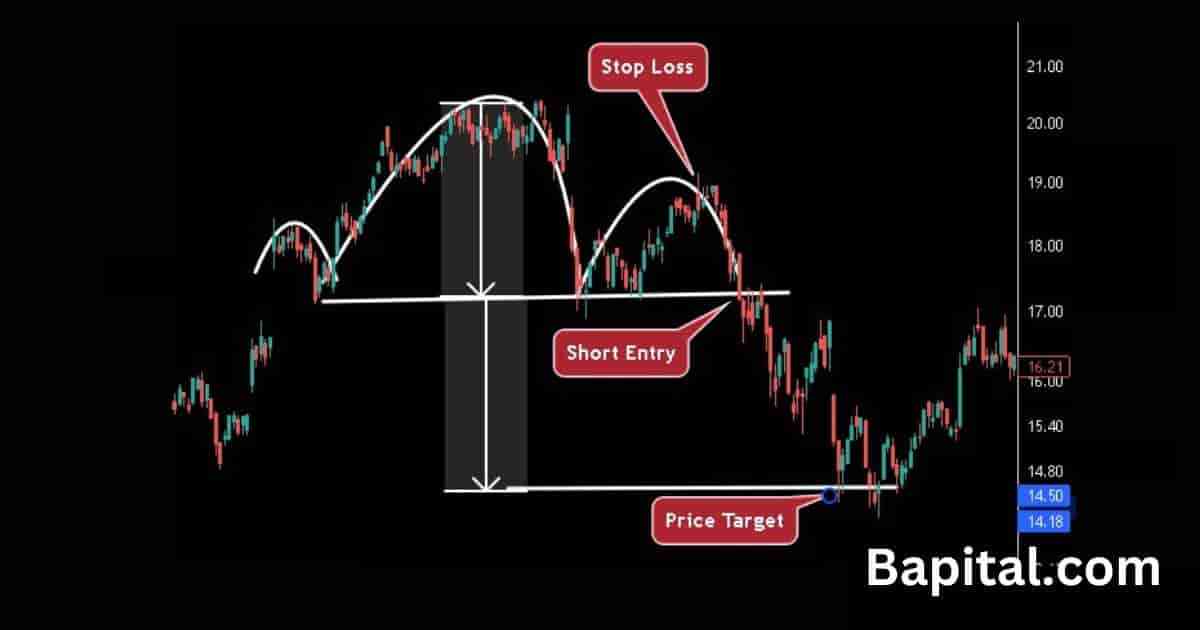
A head and shoulders pattern entry point is set when the price breaks below the neckline level of the pattern. This is the short entry point for the trade. Watch for increasing selling volume and bearish momentum as the prices declines below this support line.
3. Set The Price Target Order For Trade Position Profit Taking
The third head and shoulder pattern trading step is to set a price target order by calculating the head height and subtracting this number from the short entry price.
What Is The Price Target Of a Head and Shoulders Pattern?
A head and shoulders pattern price target is set by calculating the height of the pattern between the head peak and the neckline support level and subtracting this measurement from the short entry price. For example, if a head and shoulders pattern short entry price is $40 and the head swing high point is $50, the profit target is $30 ($40 - $10).
A higher height of the pattern between the head resistance and support line means a higer risk/reward ratio.
What Is The Price Target Calculation Formula Of a Head and Shoulders Pattern?
The head and shoulders pattern price target formula is: H&S Price Target = Short Entry Price - Head Height.
4. Place A Stop-Loss Order Above The Right Shoulder's Swing High Price
The fourth head and shoulder pattern trading step is to place a stop-loss order directly above the right shoulder's swing high point. Use a stop market order or stop limit order when placing the stop loss but be aware of order slippage.
What Is The Risk Managemenet When Trading Head and Shoulders?
The head and shoulders pattern risk management is set by placing a stop-loss order above the swing high price of the right shoulder. A risk of 1% of trading capital is the risk amount when trading head and shoulders so traders should adjust their postion size accordingly. Traders use stop losses to protect against false breakout signals, price fakeouts, and trading capital protection.
What Is The Reward/Risk Ratio Of A Head and Shoulders Pattern?
The head and shoulders pattern risk/reward ratio is 2:1 meaning a reward of $2 for every $1 risked.
How Important Is Risk Management When Trading Head and Shoulders Patterns?
When trading head and shoulder patterns, risk management is extremely important as risk management protects against significant capital losses and risk management strategies account for increasing market volatility, allowing traders to adjust position sizes accordingly.
What Are The Risks Of Trading a Head and Shoulders Pattern?
Head and shoulder pattern trading risks include price gap ups causing trade losses, illiquid markets causing large order slippage issues, and market news events causing lower pattern success rate.
What Are Common Mistakes When Trading Head and Shoulder Patterns?
The head and shoulder pattern common mistakes are risking 2%+ of trading capital per trade, ignoring market announcements, ignoring market liquidity and volume, and a lack of patience.
5. Analyze The Trading Volume As The Market Price Drops Lower
The fifth head and shoulders pattern trading step is to analyze the volume indicator as the asset price falls below the pattern support point. Watch for increasing selling pressure as increased sellers is a confirmation signal as prices fall and rising seller volume incrases the trading odds of a successful trade.
6. Adapt To The Market Conditions Dynamically
The sixth head and shoulders pattern trading step is to adapt to market conditions dynamically. Dynamically adapt to evolving market conditions, remaining flexible in response to emerging price action, and adjusting the trading strategy accordingly.
7. Conduct Post-Trade Analysis
The seventh head and shoulders pattern trading step is to conduct post-trade analysis. Conduct an exhaustive post-trade analysis to distill insights from the trade's outcome, assimilating lessons for ongoing refinement of trading strategies and decision-making processes. Include annotated charts, entry point and exit point information, trading psychology dynamics, and trade position size information in the post trade analysis.
What Are The Rules Of Trading a Head and Shoulders Pattern?
The head and shoulders pattern trading rules are below.
- Utilize cutting-edge pattern recognition software to find head and shoulders formations quickly
- Employ strict risk management rules by risking a maximum of 1% trading capital
- Calculate the short entry price, estimated price target, and stop-loss level before entering the short trade position
- Integrate the volume indicator to provide a more nuanced understanding of the pattern's formation
- Monitor the selling volume as price breaks down and trends lower
- Avoid trading prior to or during important market news events like company earning reports, non-farm payroll releases, etc. as market price volatility is increased during these news periods
- Validate the significance of the head and shoulder pattern through rigorous backtesting and statistical validation processes
- Correlate a head and shoulders pattern occurrence with broader economic events to establish a comprehensive market narrative
What Is a Head and Shoulders Pattern Trading Strategy?
A head and shoulders trading strategy is the 10EMA H&S trailing stop strategy. Scan daily price charts looking for the head and shoulder chart pattern usiong a chart pattenr recognition screener. Put a 10 exponential moving average (EMA) overlay on the chart. Enter a shorting position when the price breaks below the support neckline level on increased selling pressure (red volume bars).
Set a trailing stop-loss order along the 10EMA. When the price candlestick closes above the 10EMA, close the trading position. Set the position size to 1% of trading capital on the initial sell entry. Do not apply this strategy prior to or during market news.
What Type Of Trading Strategies Use Head and Shoulder Patterns?
Head and shoulder patterns are used in different types of trading strategies including day trading strategies, swing trading strategies, position trading strategies, automated trading strategies, and short-term scalping strategies.
What Type Of Traders Trade Head and Shoulder Patterns?
The head and shoulder pattern traders include day traders, swing traders, position traders, professional technical analysts, and active investors.
What Are Examples Of a Head and Shoulder Chart Pattern?
Head & shoulders historical chart pattern examples are below.
Head and Shoulders Pattern Stock Market Example
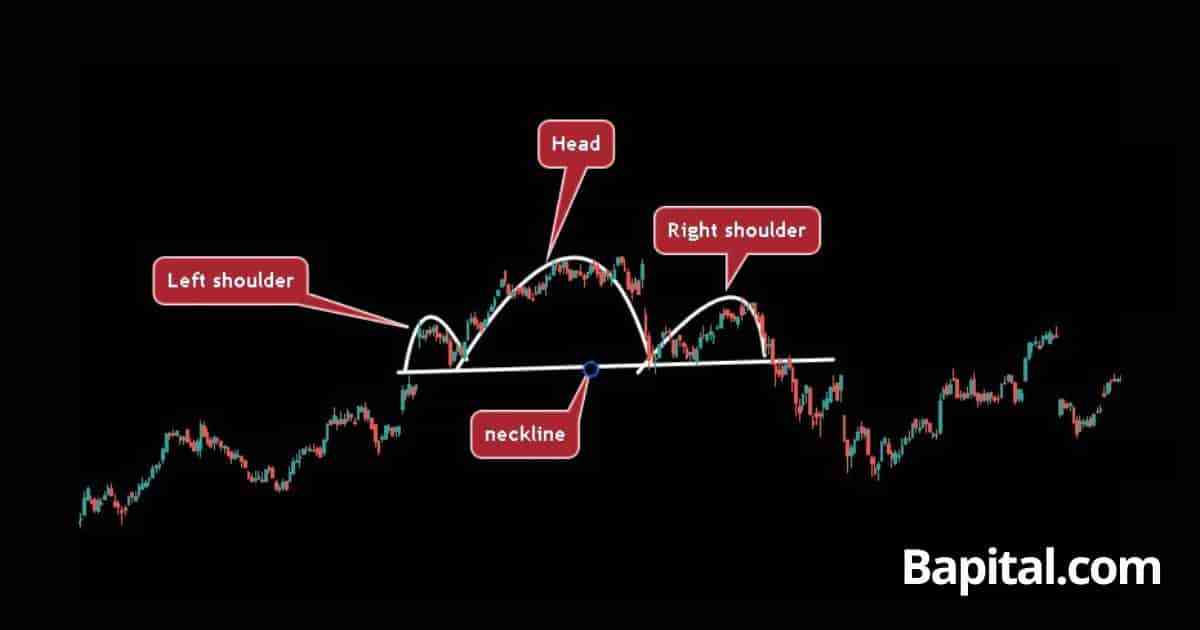
A head and shoulders pattern stock market example is illustrated on the daily price chart of Amazon stock (AMZN) above. The pattern forms at the end of a minor bullish trend. After a sideways consolidation period with choppy price action, Amazon stock price reverses from bullish to bearish and the stock price breaks below the neckline support area. After the price of Amazon stock breaks below the neckline, the price of the market started a bearish trend and falls to lower levels to reach the exit price.
Head and Shoulders Pattern Forex Market Example
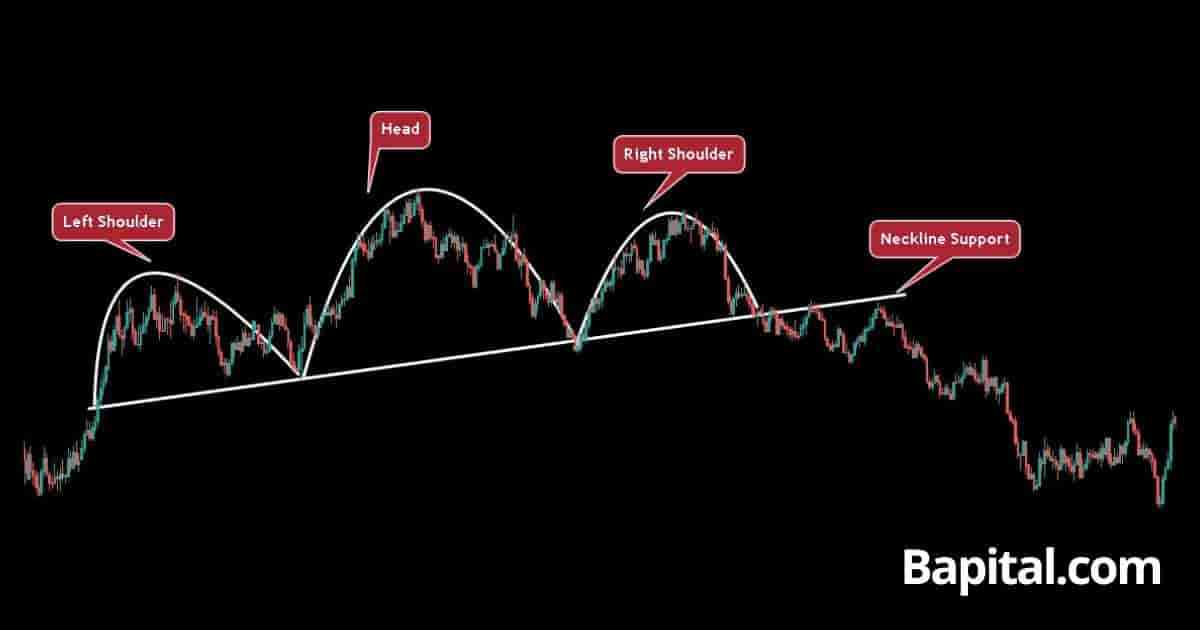
A head and shoulders pattern forex market example is illustrated on the daily forex chart of EUR/USD currency pair above. The pattern forms at the end of a bullish trend with a upward sloping neckline support level. After a consolidation phase, the price reversal from bullish to bearish occurs. The currency price breaks down and falls below the support level and continues in a downward bearish price trend before reaching the profit target level.
Head and Shoulders Pattern Short Timeframe Example
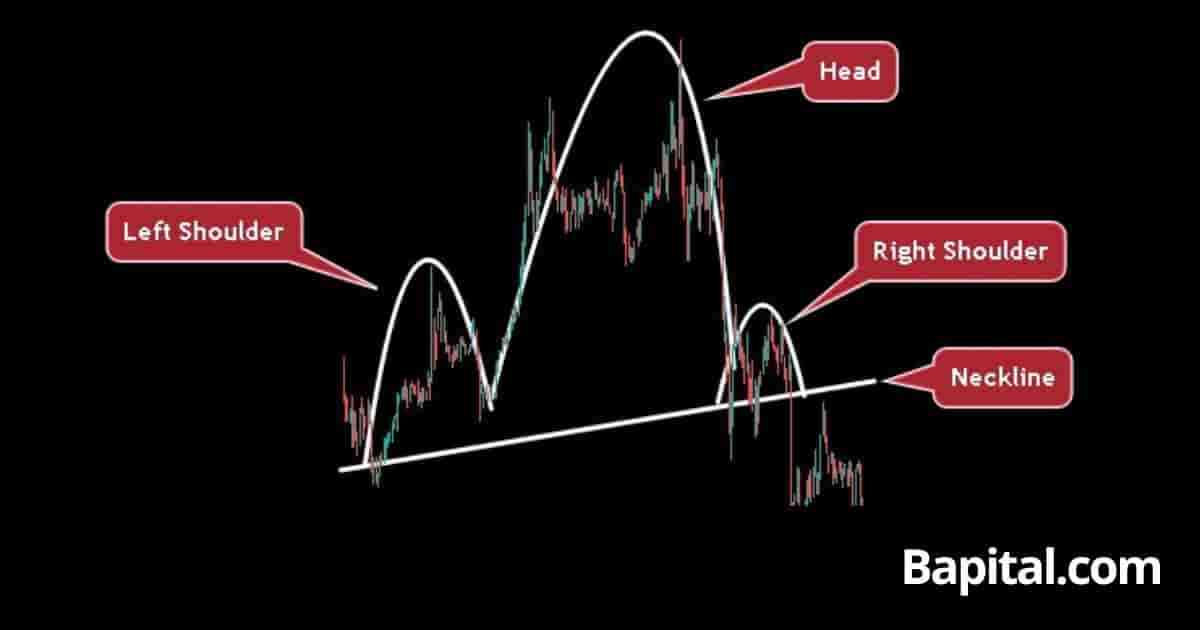
A head and shoulders pattern short timeframe example is illustrated on the 5-minute financial chart of Bitcoin above. The pattern forms at the end of a short term bullish movement. The price consolidates in a volatile range before a price reversal in a declining bearish trend after breaking the support level of the pattern.
Head and Shoulders Pattern Long Timeframe Example
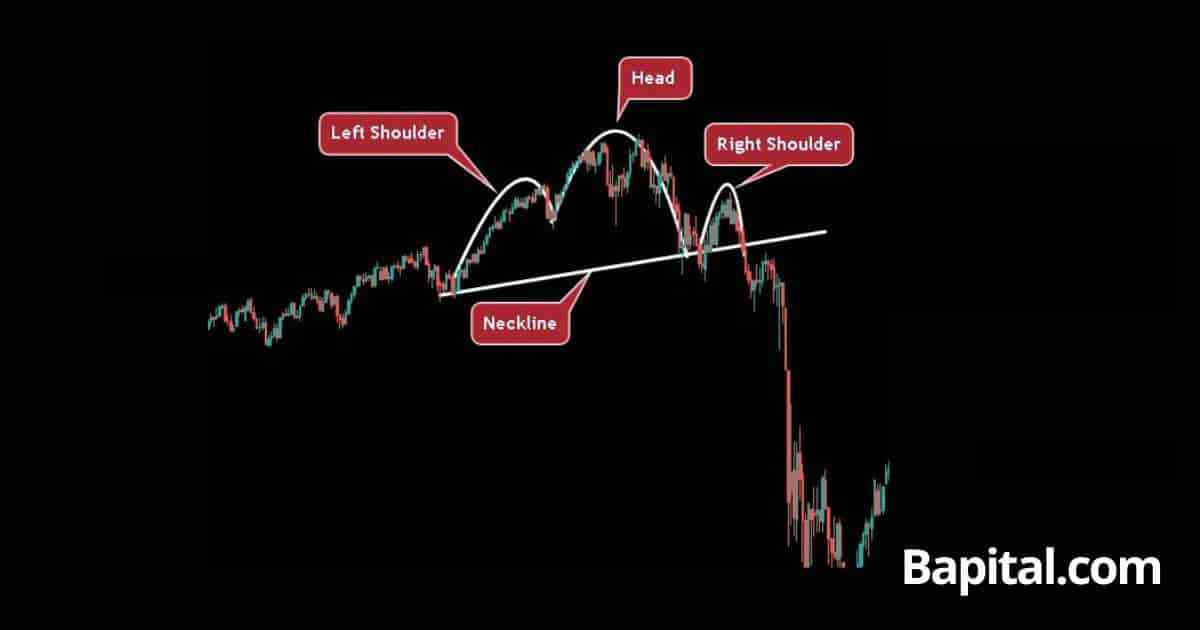
A head and shoulders pattern long timeframe example is shown on the weekly market chart of the S&P500 (SPX) above. The pattern forms at the end of a multi-year bullish trend. Price consolidates in a multi-month volatile range where the left shoulder, head, and right shoulder components develop. The asset price breaks down below the support trendline and continues to decline lower over multiple months before reaching the profit level.
Head and Shoulders Pattern Failure
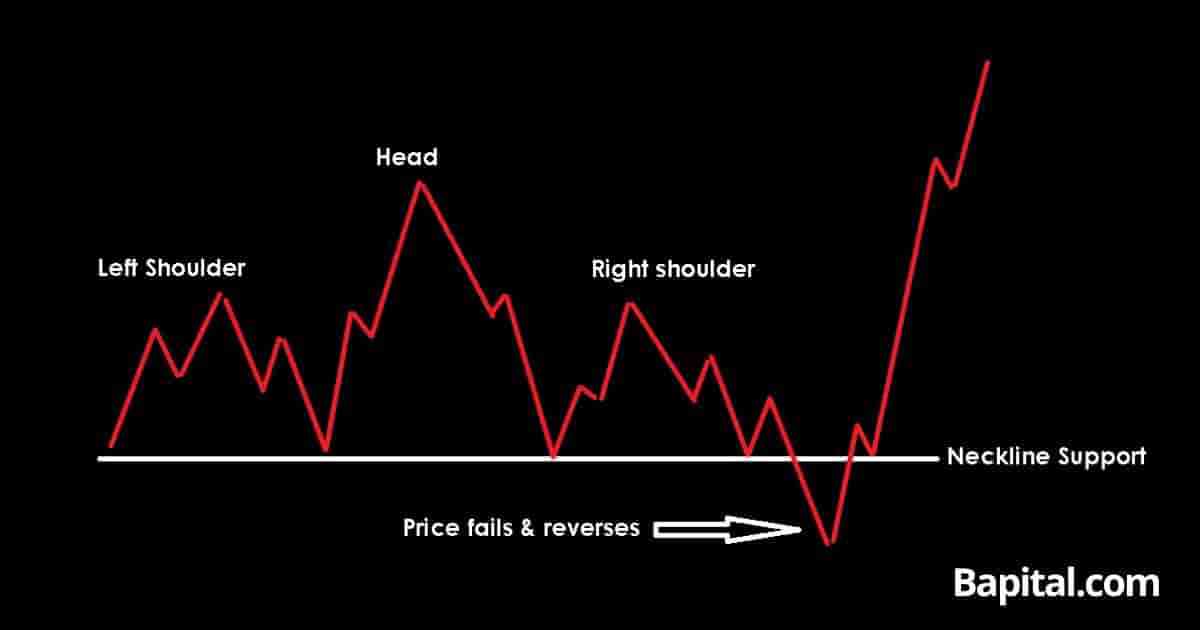
A head and shoulders pattern failure, also known as a "failed head and shoulders", is when a head and shoulders forms but fails. The head and shoulders pattern is invalidated and considered a failed pattern when the market security price declines and breaks down below the neckline support area but quickly results in a major reversal and turns bullish before reaching the pattern target. It is considered a failure once the market price rises from below the support trendline to above the swing high of the right shoulder. A head and shoulders pattern failure is a bullish signal.
What Causes a Head and Shoulders Pattern To Fail?
Head and shoulders pattern failure causes are below.
- Lack Of Selling Volume: A head and shoulders pattern failure can be caused by low selling volume during a price breakdown from the pattern support level signaling there is no real conviction in the bearish trend
- Low Liquidity: A failed head and shoulders can be caused by low liquidity with very few sellers or buyers in a market. Lower liquidity means one market participant can change the trend direction
- Political & Economic News: A head and shoulders pattern can fail due to unexpected market news leading to high price volatility in a financial market and causing unexpected price movement in a bullish direction
What Are The Benefits Of a Head and Shoulders Pattern?
The head and shoulder pattern benefits are below.
- Helps Provide Logic And Understanding: A head and shoulders pattern helps provide an understanding of the price action in a market and it provides logic as to what is occurring
- Enables Trend Reversal Predictions: The head and shoulders pattern is a reliable indicator of a potential trend reversal. It is used to identify the end of a bullish trend and anticipate a upcoming bearish trend. This can be a crucial signal for traders looking to exit long positions or initiate short positions in the market
- Helps Provide Clear Entry And Exit Trade Signals: The pattern offers clearly defined entry and exit points. A short position is entered when the price breaks below the neckline. This specific entry point helps manage risk and optimize profit potential
- Works Across All Global Markets: This pattern works in all markets including stocks, futures, forex, cryptocurrencies, options, commodities, indices, and bonds, making it a valuable tool
- Works Across All Timeframes: The head and shoulders pattern is versatile and can be applied across various timeframes, from short-term scalping to long-term investing. This versatility makes it accessible to a wide range of traders and investors
What Are The Limitations Of a Head and Shoulders Pattern?
The head and shoulder pattern limitations are listed below.
- False Signals: Head and Shoulders patterns may form but fail to lead to a bearish price reversal. Traders must use strict risk manangement and use other forms of analysis or confirmation before making trading decisions
- Variability in Pattern Symmetry: Not all head and shoulders patterns are symmetrical. Asymmetry can make pattern recognition more challenging for newer traders and may result in less reliable signals
- Subjectivity: Identifying the pattern can be subjective. Different traders may interpret the pattern differently, which can lead to discrepancies in analysis
Traders need to be fully aware of these drawbacks before using the head and shoulders pattern in their trading.
Head and Shoulders Pattern Psychology
The head and shoulders pattern psychology is reflected by the ebb and flow of market sentiment, highlighting the interplay between optimism and caution among traders before the bearish sentiment prevails.
The pattern consists of three peaks: a higher peak (head) between two lower peaks (shoulders). The left shoulder is formed as the price reaches a high, followed by a temporary decline. The subsequent rise creates the higher peak of the head, often marked by increased optimism and buying pressure. The right shoulder forms as the price retraces again, with investors becoming more cautious.
The pattern suggests a shift from bullish sentiment to bearish sentiment. Traders who were initially optimistic during the left shoulder and head phases may start to doubt the sustainability of the trend, leading to increased selling pressure during the right shoulder before complete negative sentiment as the price breaks below the neckline area.
What Are The Statistics Of Head and Shoulders Patterns?
How Accurate Is a Head and Shoulders Pattern?
Head and shoulder pattern accuracy is 52% win rate from our backtesting data of 4,034 of these patterns on daily price charts across multiple financial markets. This is in stark contrast to claimed win rates of 80%+ by some market commentators.
Is a Head and Shoulders Pattern Reliable?
Yes, head and shoulder patterns are reliable if traders correctly follow the trading rules. The higher timeframe daily, weekly, monthly, and yearly timeframe head and shoulder patterns are more reliable than shorter timeframe 1 second, 1-minute, and 5-minute head and shoulders.
What Market Conditions Is a Head and Shoulders Pattern Most Reliable?
A head and shoulder pattern is most reliable at the end of a bullish trending with bullish price exhaustion market conditions.
What Market Conditions Is a Head and Shoulders Pattern The Least Reliable?
A head and shoulders pattern is the least reliable in a sideways trading range market conditions with the market price moving in no clear direction.
Is a Head and Shoulder Pattern Profitable?
Yes, head and shoulder patterns are profitable as the average win rate is 52% and the average return to risk ratio of 2 to 1. This means for every 1,000 trades, a trader wins 520 trades making 2 units (1,040 units total) and losses 480 trades losing 1 unit (480 units total). Therefore, over 1,000 trades, a trader should hypothetically net 560 units (1,040 units - 480 units). Be aware that past performance is not indicative of future trade results.
What Are The Alternatives To Head and Shoulder Patterns?
The head and shoulder pattern alternatives are listed below.
- Bearish pennant pattern
- Descending triangle pattern
- Symmetrical triangle price pattern
- Triple tops
- Double tops
- Diamond chart pattern
- Price channels
What's The Opposite Of A Head and Shoulders Pattern?
A head and shoulders pattern's opposite is the inverse head and shoulders pattern, also known as a head and shoulders bottom, which is a bullish signal.
What's The Difference Between a Head and Shoulders and Inverse Head and Shoulders Pattern?
The head and shoulder pattern differences with an inverse head and shoulders pattern are its shape and what it signals. A head and shoulder pattern is a bearish signal while an inverse head and shoulders pattern is a bullish signal. A head and shoulders pattern is shaped like a head with two shoulders while an inverse head and shoulders pattern is shaped like an upside down head with two shoulders.
What Are The Key Facts Of The Head and Shoulders Pattern?
The head and shoulder pattern key facts are below.
