Some technical analysis indicators are particularly helpful for swing trading.
These trading indicators are easy to use and offer good clear swing buying and selling signals in multiple markets from stocks, commodities, forex, cryptocurrencies, and indexes.
The technical indicators listed are of different types from trend- following indicators, mean reversion indicators, momentum indicators and volume indicators.
The best technical indicators for swing trading are:
- Moving Averages
- Keltner Channels
- Ease Of Movement
- Average Directional Index
- Chart Pattern Scanner
- Money Flow Index
- Volume
These trading indicators are among the most popular for swing traders to use.
1. Moving Averages
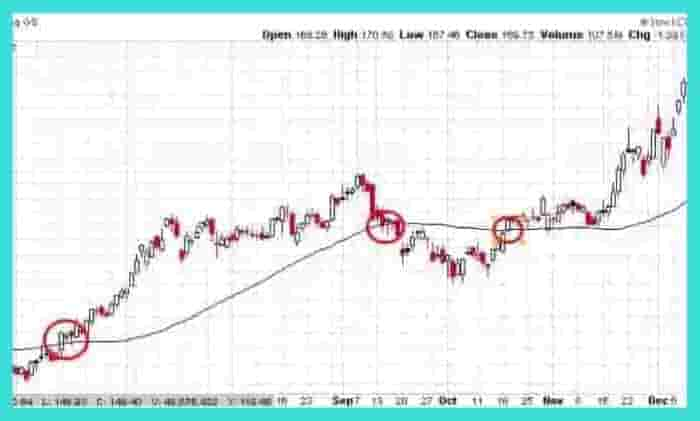
Moving Average (MA) is one of the best indicators for swing traders to use.
The moving average helps swing traders spot trends in markets and can help signal when a trend is ending.
The types of moving averages used for swing trading are the exponential and simple moving averages.
Swing traders commonly use the 50 day, 100 day and 20 day moving averages.
Why Moving Averages Are Great Swing Trading Indicators
Moving average indicators are great in swing trading because:
- They can indicate when a new trend is forming: When moving averages crossover, it can signal a new trend is developing in the market, especially when used on daily or weekly timeframe charts.
- They offer potential exits for swing trade positions: When the price breaches a moving average line, it can indicate it’s time for a trader to exit a trade.
2. Keltner Channels
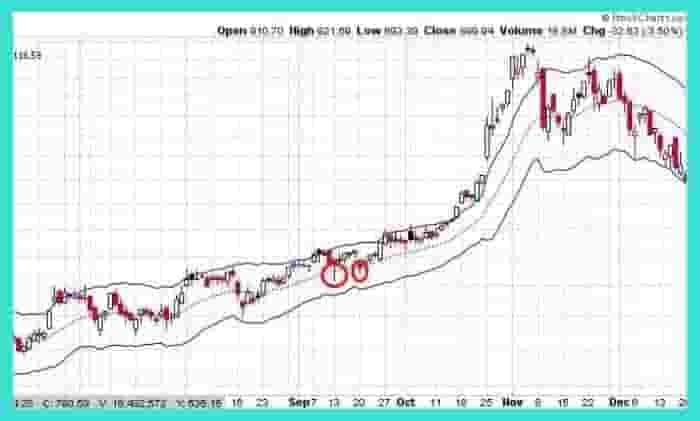
Keltner channels are a great indicator used in swing trading. They can be used as both a trend following or mean reversion indicator depending on how a swing trader chooses to use them.
The Keltner channel overlays 3 lines on price charts of markets, an upper line, a middle line and a lower line.
Why Keltner Channels Are A Great Swing Trading Indicator
Keltner channels are a top swing trading indicator because:
- They help spot potential support/resistance levels in price trends: During long periods of trending markets, the middle line can be used as a support/resistance level for swing buying or swing shorting.
- They can signal a potential new price trend: When the Keltner channels tighten up and then break above/below the outer lines, it can signal a new trend has formed.
3. Ease Of Movement
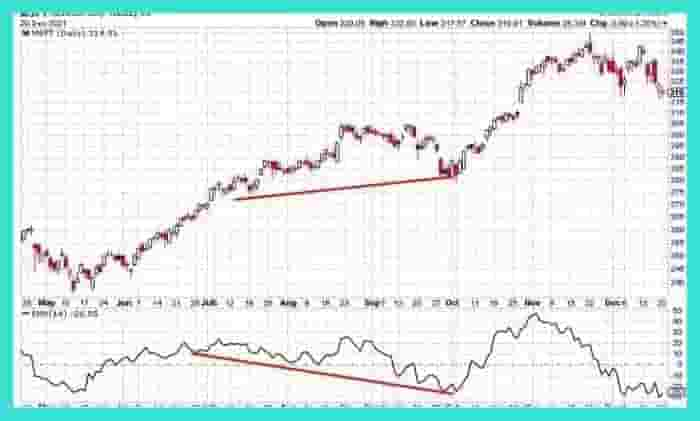
The ease of movement indicator measures price momentum and volume together and plots it on the ease of movement indicator.
The ease of movement helps swing traders assess the strength of a price trend.
Why Ease Of Movement Is A Great Swing Trading Indicator?
The ease of movement indicator is great for swing trading because:
- It helps measure the strength of a price trend: When the ease of movement is above 0, it’s considered a bullish signal.
- Divergences between indicator and price can lead to big movements: When there is a technical divergence between the price and indicator, it can lead to large price movements (as evident from the price chart below).
- It can help with exiting swing trades: This indicator can help swing traders with exiting trading positions. When the ease of movement starts to lose power, it can signal an exhaustion of a trend.
4. Average Directional Index
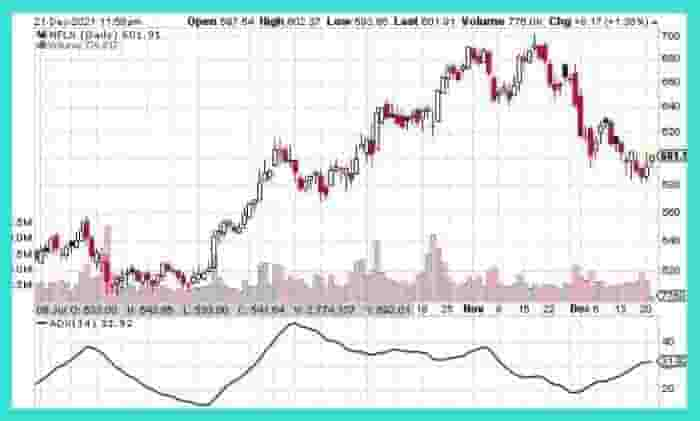
The average directional index (ADX) is an indicator that measures the strength of a trend. The indicator works best for trend following swing trading strategies.
The important readings for the average directional index are below 20 which indicates the trend is weak or above 40 which means the trend is strong.
Why The Average Directional Index Is A Great Swing Trading Indicator
The average direction index indicator is useful for swing trading because:
- It helps measure the strength of a trend: The ADX indicator helps indicate how strong a trend is. This can help with choosing to enter swing trades.
- It helps with knowing when to exit swing trades: If the ADX is declining, it indicates the trend is losing strength which can help indicate to close a swing trade.
5. Chart Pattern Scanner
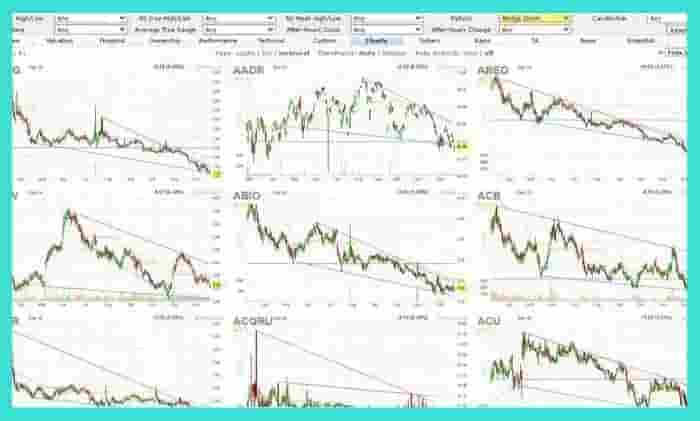
Chart pattern scanner is an indicator that scans the markets for technical analysis chart patterns like wedges, head and shoulders etc.
This scanner finds these popular chart patterns forming in any market without a trader manually sifting through price charts.
Why The Chart Pattern Scanner Is A Top Swing Trading Indicator
The chart pattern scanner is a great technical indicator because:
- It quickly scans multiple markets for patterns: The chart pattern scanner indicator can help save time by finding chart patterns in any market without having to manually go through every price chart.
- It helps find chart patterns a trader might miss: The indicator can help find chart patterns that a trader may miss when eyeballing price charts.
6. Money Flow Index
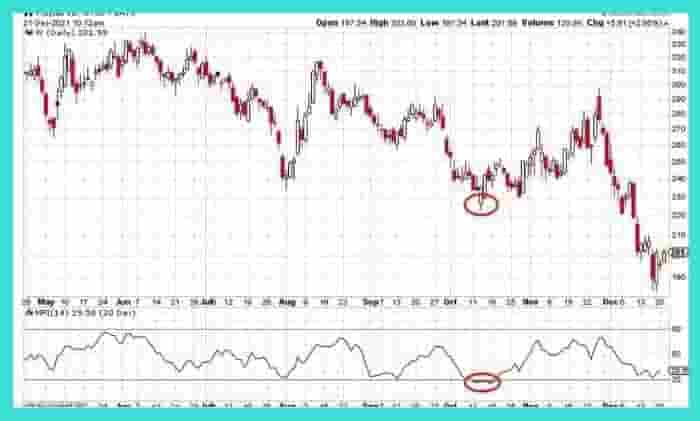
The money flow index is an oscillator that indicates oversold and overbought conditions in a market.
The oscillator ranges from 0 – 100. It works best for mean reversion swing trades.
Why The Money Flow Index Is A Top Swing Trading Indicator
The money flow index is a great swing trading indicator because:
- It helps a swing trader spot overbought and oversold conditions:The money flow index helps a swing trader identify when markets are overbought or oversold.
- It adds confirmation when used with support/resistance levels: This indicator can add an extra layer of confirmation to a buying/selling signal when used with support/resistance levels.
- It’s easy to learn: Any new swing trader can easily learn how this indicator works relatively easy.
7. Volume
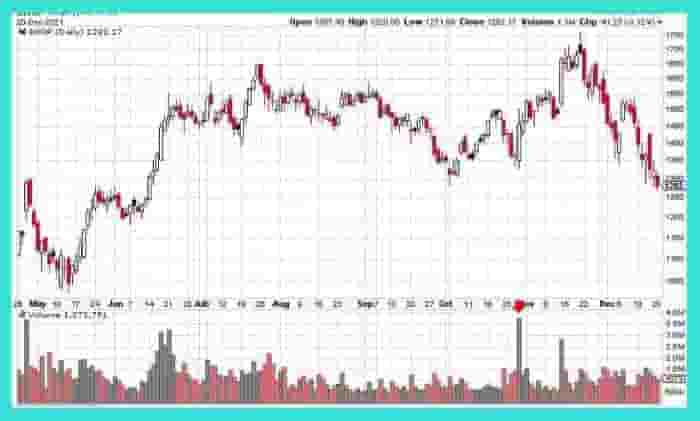
Volume is the best indicator that swing traders use. The volume indicator simply displays how much volume trades at different times of the trading day.
Volume indicator shows how much buying and selling occurred at a particular price.
Why Volume Is One Of The Best Swing Trading Indicators
The volume indicator is one of the best technical indicators for swing trading because:
- It helps add confirmation to swing trades: If a swing trader buys a breakout, a large volume amount.
- It can signal institutional buying: A large increase in volume can indicate a rise in institutional ownership which can add more confidence to a swing trade if smart money is also involved.
Conclusion
A swing trader should use these indicators on a demo trading account when first applying them.
This means a swing trader can practice swing trading with these indicators without risking real capital as they learn the inner workings of each technical indicator listed.
